18. Targeted: ParaView Web
18.1. Introduction
ParaViewWeb, is a Web framework to build applications with interactive scientific visualization inside the Web browser. Those applications can leverage a VTK and/or ParaView backend for large data processing and rendering.
There are example prototypes that have been built using the ParaViewWeb framework. Here is a webpage that has 4 of them - https://pvw.kitware.com/.
18.2. Visualizer
Visualizer is a web based prototype of ParaView using the ParaView Web framework. Click on the Visualizer icon. This brings up a web client, connecting to a backend server located at Kitware headquarters, in Clifton Park, New York. Visualizer can connect to any ParaView server, but in this case they use Kitware headquarters.
In the upper left corner are menu options. Running from the left side, these icons are:
Pipeline view.
Open File.
Note that this is wherever the server is located. In this example, it is in New York state.
Filters.
This is a subset of the ParaView Filters. Note that almost any ParaView filter can be exposed, customizing this list to the needs of the user.
Save Screenshot.
This will save locally or remotely, depending on the needs of the user.
Information.
This will give information for whatever filter is selected in the pipeline browser.
Server settings.
Generally speaking, leave this alone.
Reset View
18.2.1. Example with disk_out_ref.ex2
Open disk_out_ref.ex2.
Select Filters → Clip. - Sometimes, you need to click on the little paper airplane next to the search window.
disk_out_ref.ex2 and the clip are both visible. Click the disk to the left of disk_out_ref.ex2 in the pipeline browser. Now you see the clip.
Paint by Temp.
Select disk_out_ref.ex2. The original dataset now has focus.
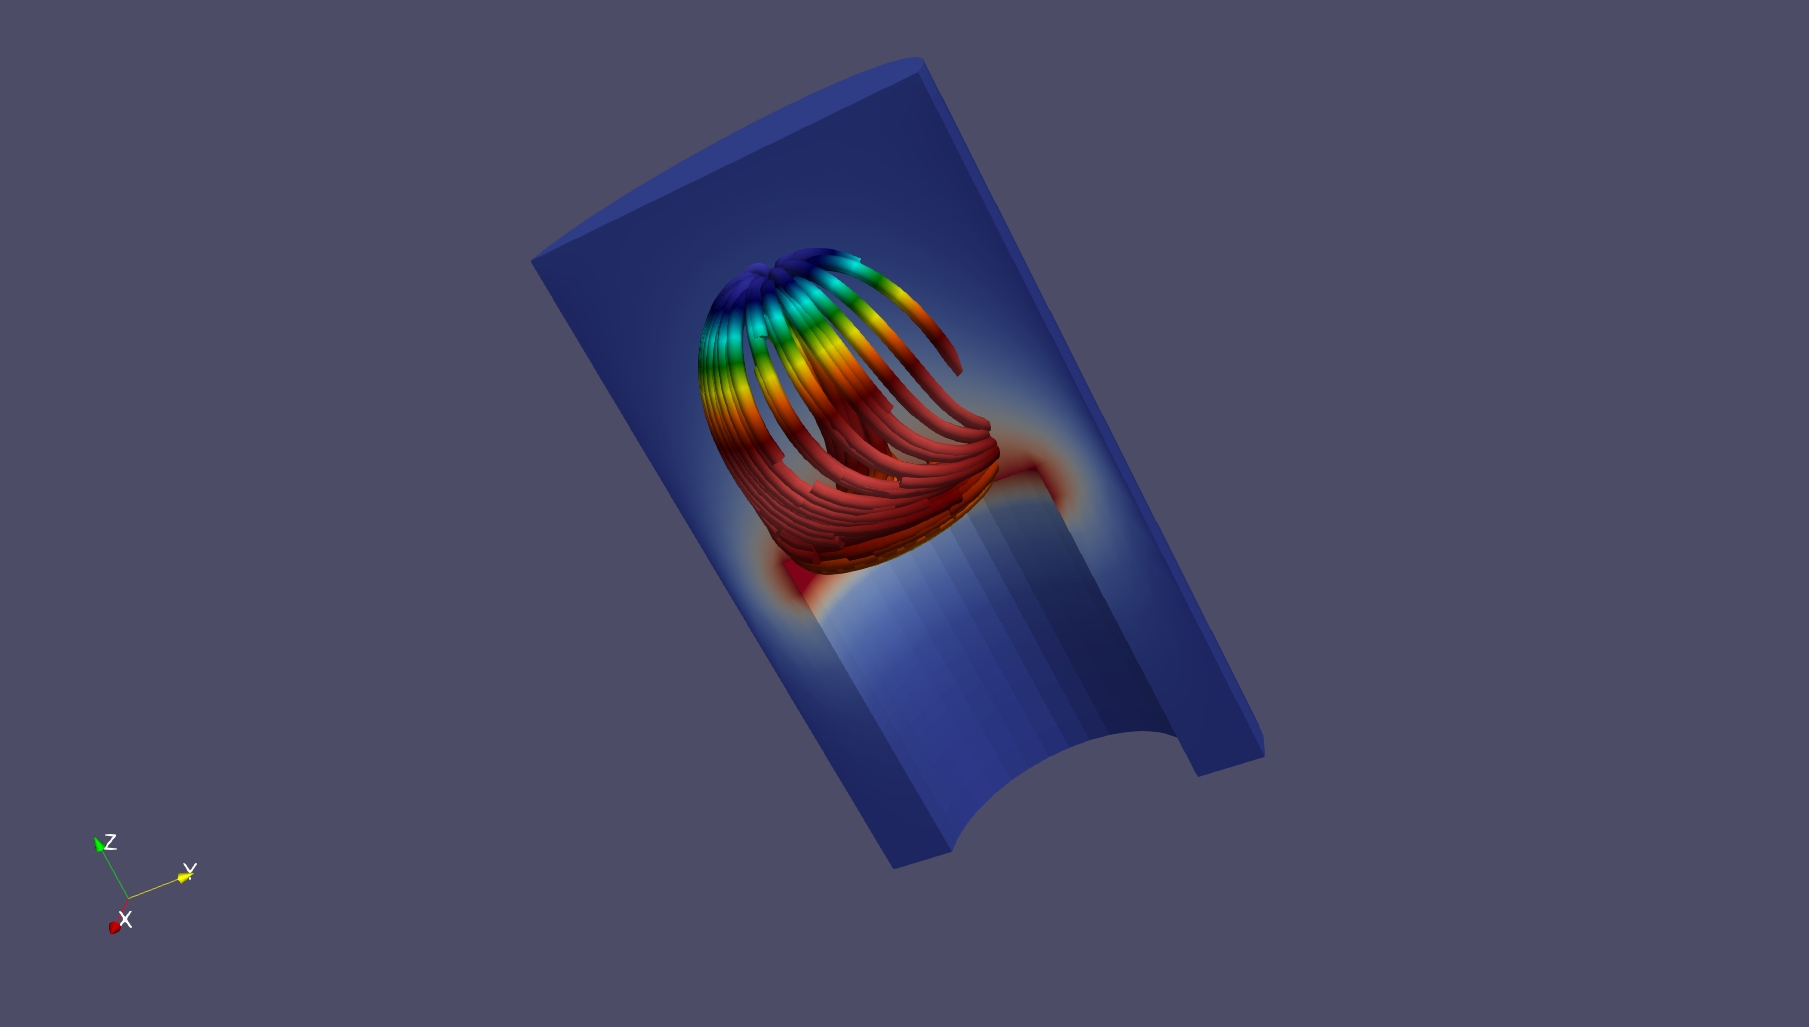
Select Filters → Stream Tracer.
Select Filters → Tube.
Paint this filter by Pres.
Change the color map to be something else. I used Rainbow Desaturated.
In the image below, I also changed the background color to .3, .3, .4.
18.2.2. Example with can.ex2
This is left as an exercise. Try slices. Play this dataset forward in time.
18.2.3. How to use a local server
Open a terminal window. This works in Linux, Windows or OS X. List available applications
pvpython -m paraview.apps -l
Now, lets run visualizer, which we can run from your local ParaView download. Documentation is found at https://kitware.github.io/visualizer/
pvpython -m paraview.apps.visualizer --data ~/ --port 1234
You will have to open your browser and point it at: http://localhost:1234/
To run divvy, use the following command. Documentation is found at: https://kitware.github.io/divvy/
pvpython -m paraview.apps.divvy --data ~/path-to-file/examples/disk_out_ref.ex2 --port 1235
To run lite, use the following command. Documentation can be found at: https://kitware.github.io/paraview-lite/
pvpython -m paraview.apps.lite --data ~/ --port 1236