4. Beginning: Color Maps & Palettes
4.1. Introduction
This usecase presents a few of the more important new ParaView GUI features. A full list of features can be found in the ParaView Guide.
Data can be opened by going to File → Open. Example data files can be found in the Examples directory, located in the upper left of the Open dialog.
4.2. Color palette
ParaView allows users to easily control the color palette. This is done
with the Load a color palette icon.  . Changing
color palettes does much more than just changing the background - it
also changes the font colors for other annotations. Options are default
gray, black, white and gradient. You can also create custom color
palettes.
. Changing
color palettes does much more than just changing the background - it
also changes the font colors for other annotations. Options are default
gray, black, white and gradient. You can also create custom color
palettes.
Here is an example of a gradient background, with the color palette menu displayed.

A famous example of surrounding colors changing a perceived brightness of an object is Edward Adelson’s Checker Shadow illusion.
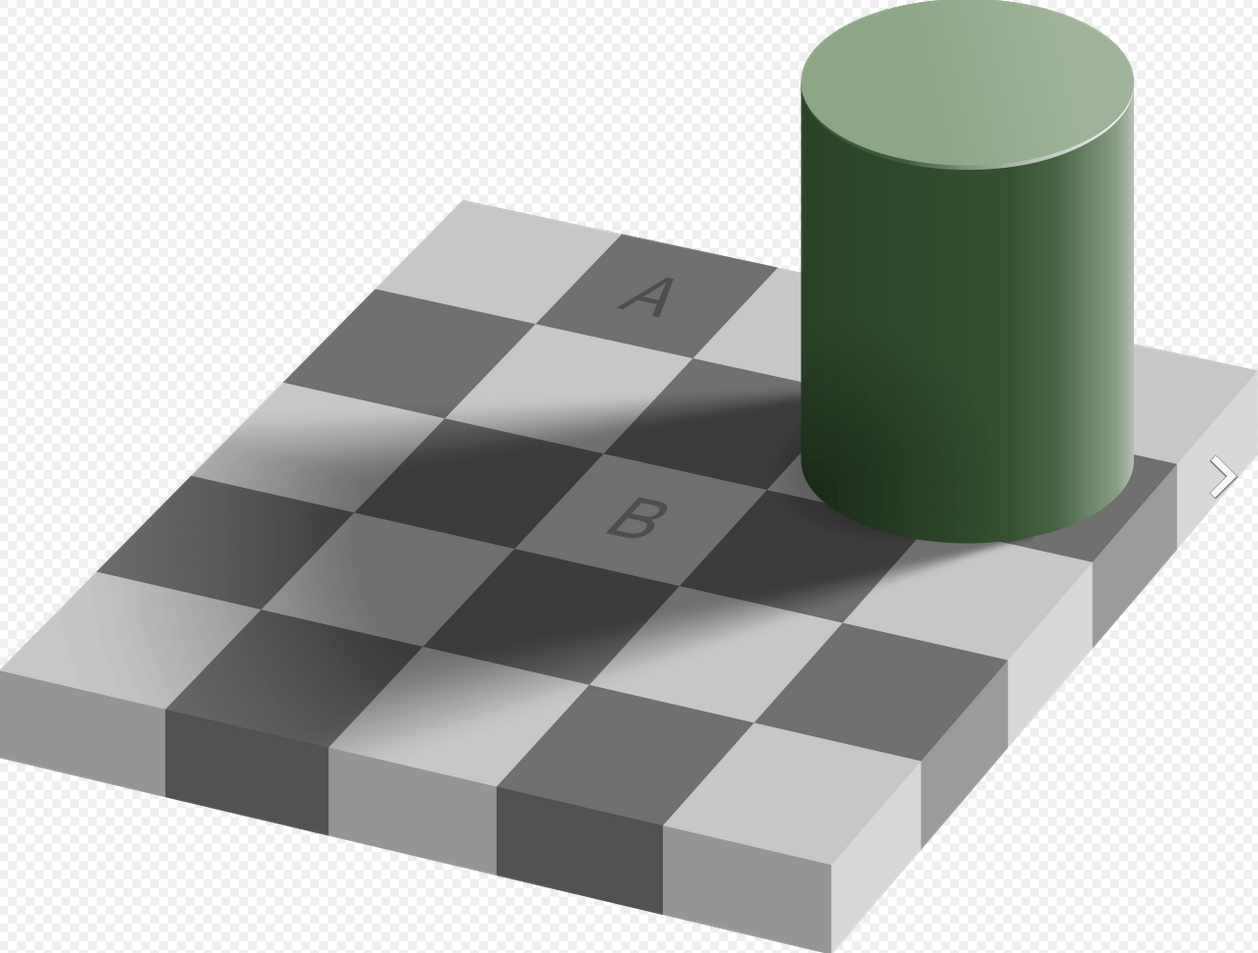
Fig. 4.35 The checker shadow illusion: the square A is exactly the same shade of gray as square B. Copyright Edward H. Adelson and Pbrks : CC BY-SA 4.0.
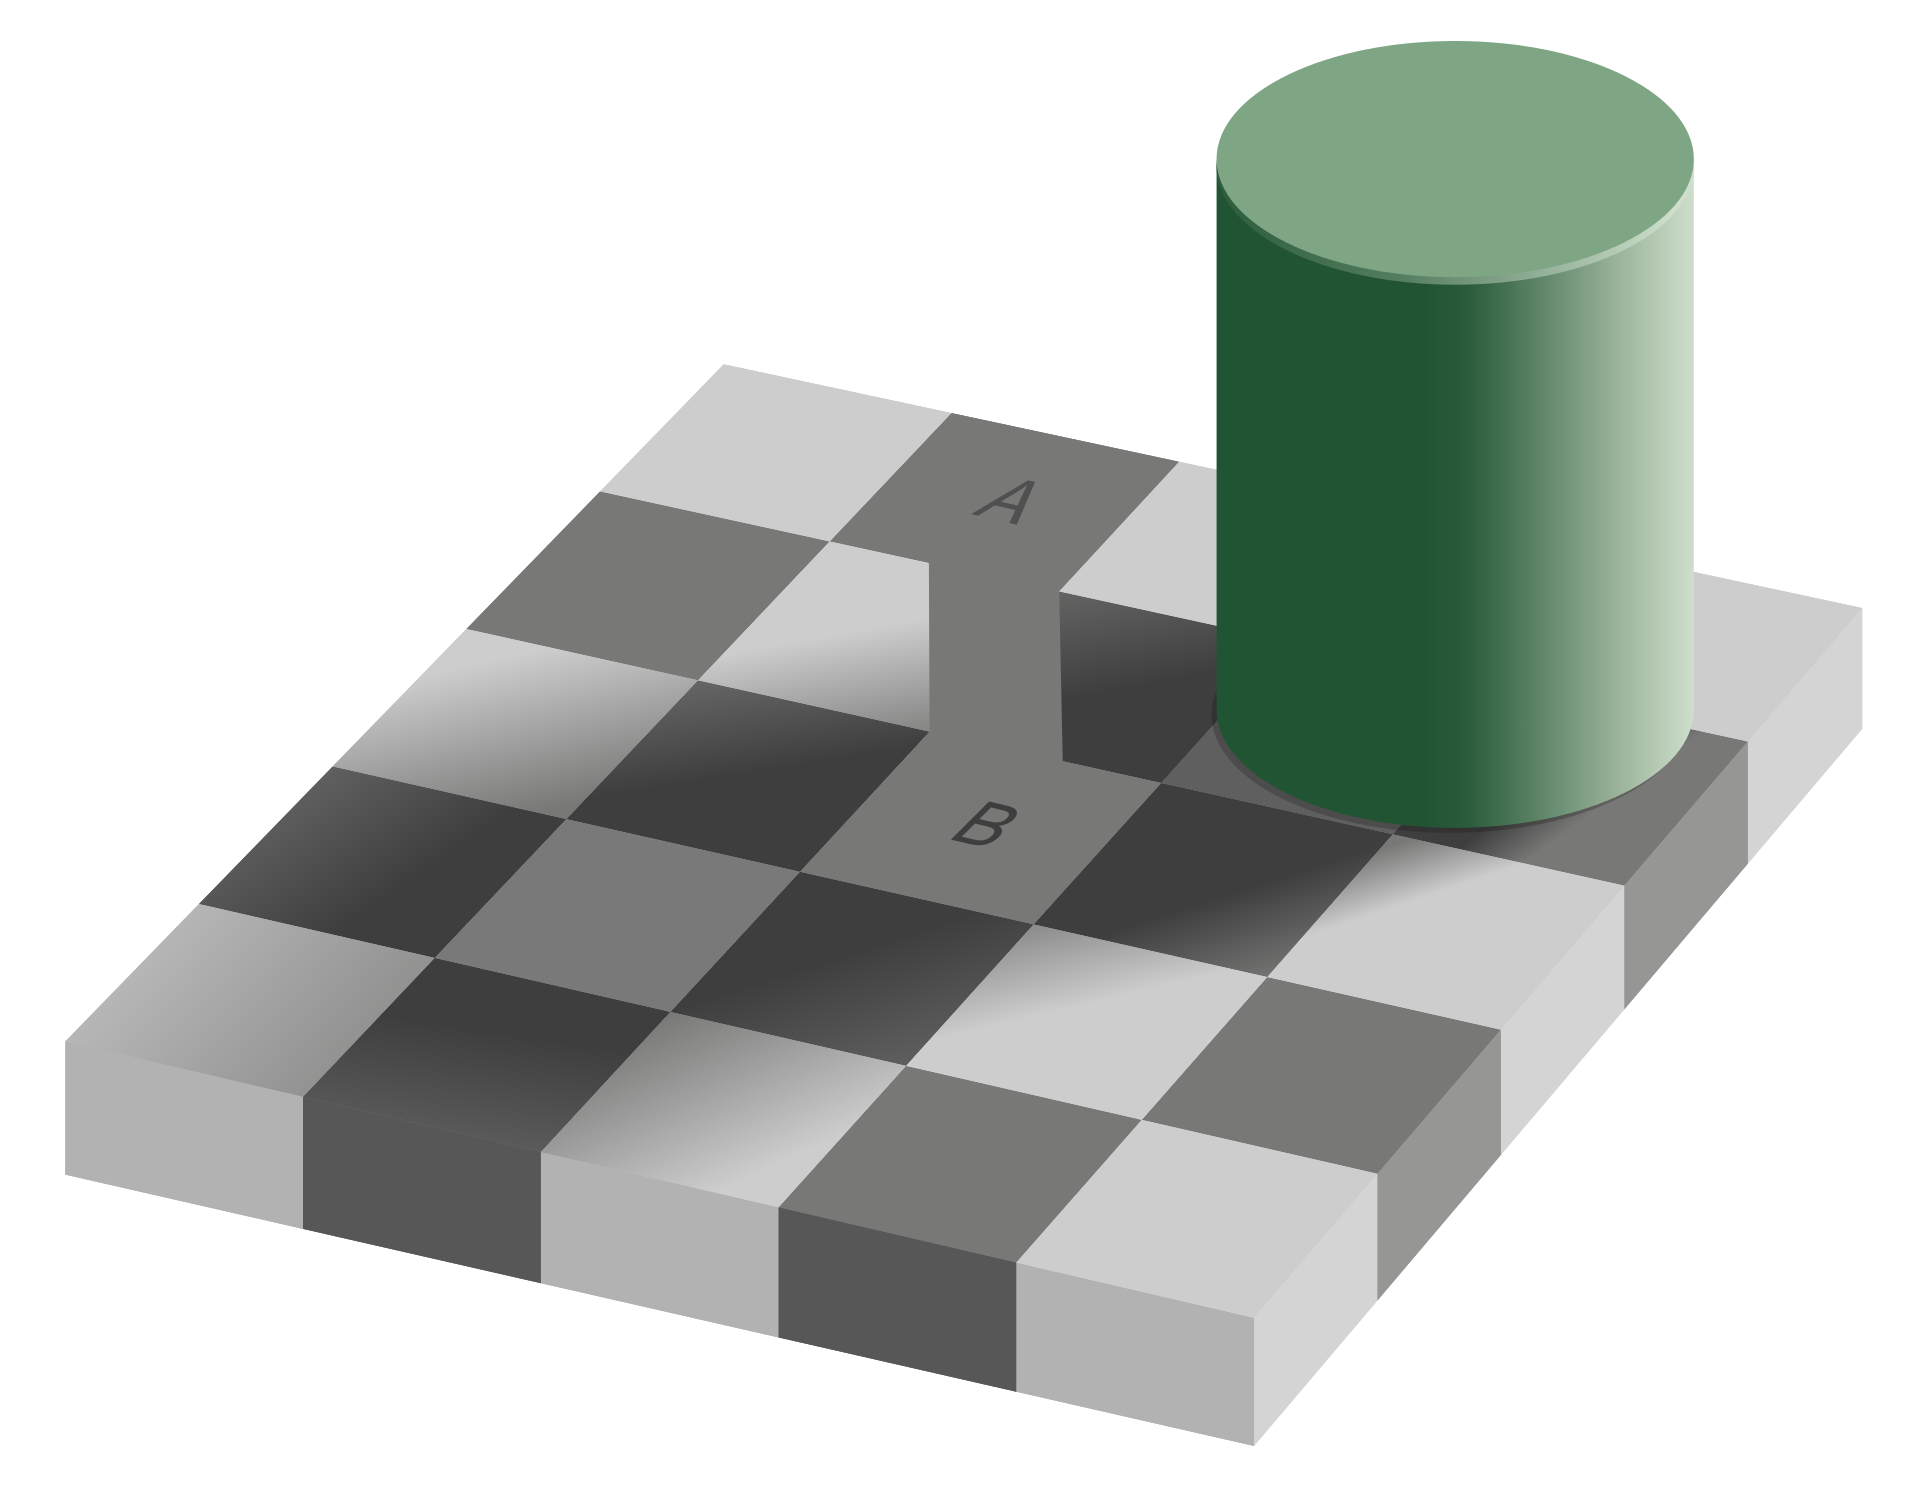
Fig. 4.36 The checker shadow illusion: drawing a connecting bar between the two squares breaks the illusion and shows that they are the same shade. Copyright Edward H. Adelson and Adrian Pingstone : Copyrighted free use.
4.3. Color Map Editor
Open can.ex2
Select the DISPL variable.
Move forward one time step using the Next Frame icon.
Here is the coloring toolbar. Icons are as follows:
Toggle color legend visibility.
Edit color map.
Rescale to data range (set Min and Max from this timestep).
Rescale to custom data range (manually input Min and Max values.
Rescale to visible data range (set Min and Max from visible objects this timestep)

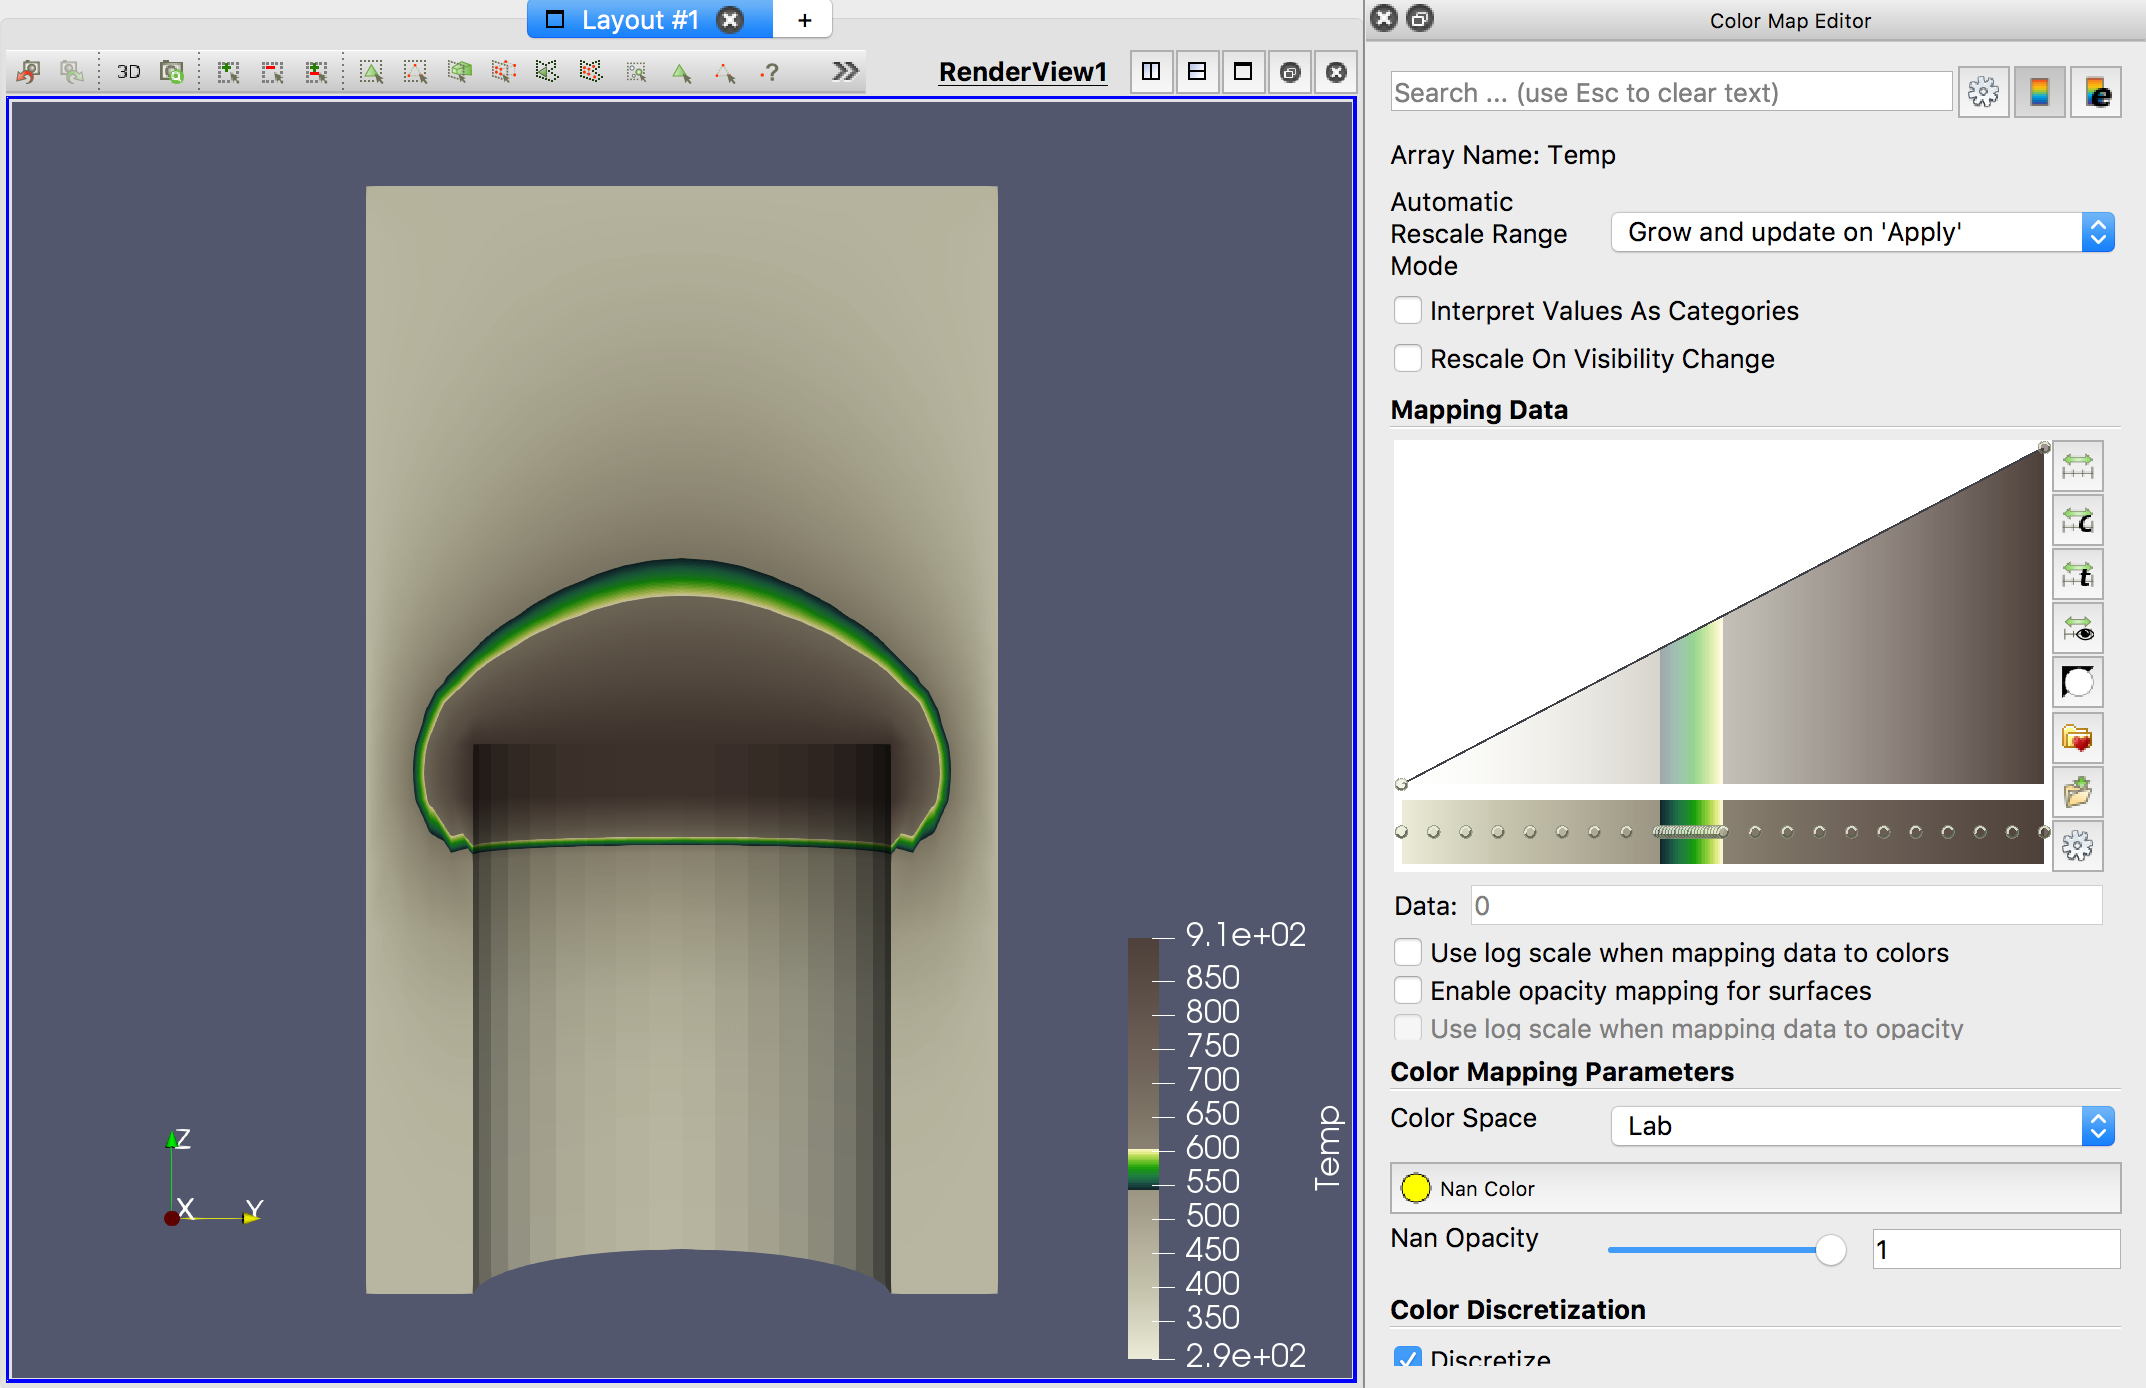
Click on the Edit Color Map icon.
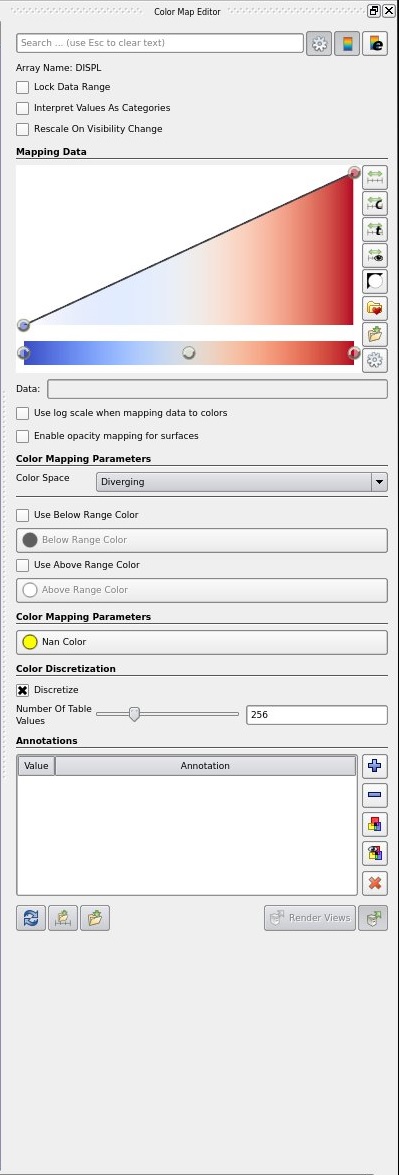
The Color Scale Editor is used to change the colormap.
Select the Use log scaling when mapping data to colors check box. Notice what has happened to the colors on the can.
Unselect Use log scaling when mapping data to colors check box.
Select the Enable opacity mapping for surfaces check box. Notice what has happened to the colors on the can.
Unselect Enable opacity mapping mapping for surfaces check box.
Select the Rescale to Data Range icon. You already know what this does.
Select the Rescale to Custom Range icon.
Set custom minimum and maximum values for the Color Legend.
Select the Rescale to Data Range over all timesteps icon. This will read in all of your data, and set the min and max based upon all timesteps.
Select the Rescale to Visible Range icon. Rescales based upon what is currently visible. To see this work, click -Z, and then roll the can down slightly to hide the can itself. Click the Rescale to Visible Range icon.
Invert the transfer function.
Invert the color table.
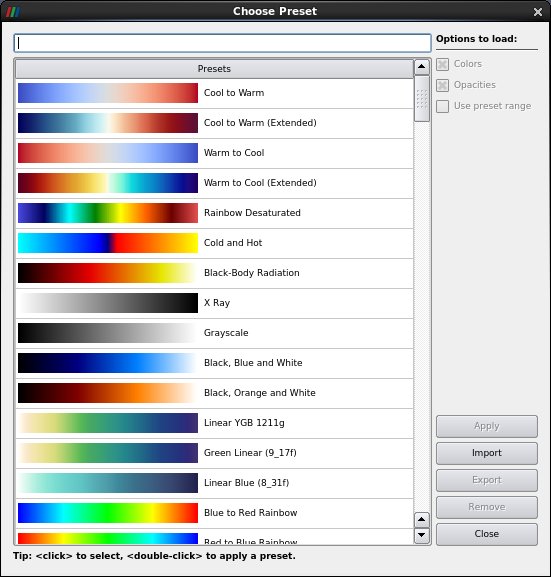
Select the Choose Preset icon.
Choose Cool to Warm
OK. Notice what has happened to the colormap. This is an easier to understand color map than the rainbow one that all of us are used to.
Next, choose the Black-Body Radiation preset. Although harder to understand (requiring an understanding of the layout of the rainbow colors), this one makes prettier pictures. The best color map to use is the default one.
Advanced. You can edit each color and opacity of the color map.
Nan Color - this is the color ParaView will use to paint nans in your data.
Click the advanced icon at the top. You can mark cells or points that are outside of the normal range of the color map.
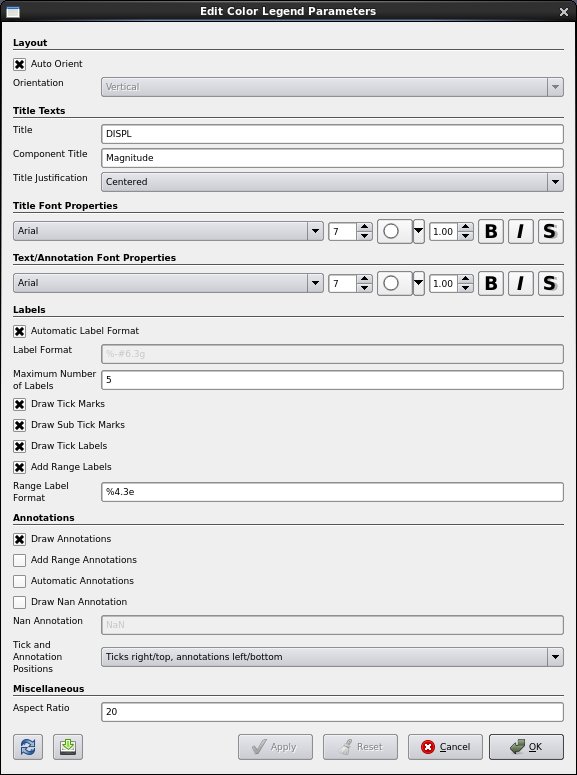
Click the color legend with the e. This is the Color Legend Editor.
4.4. Custom Color Maps
ParaView allows you to import custom color maps. This is also done on the Color Map Editor, Presets dialog. An excellent source for scientific visualization color maps is the SciVizColor website, located here: https://sciviscolor.org. Lets add a custom color map.
Go to webpage https://sciviscolor.org.
Colormap.
Wave & Highlighting Colormaps.
Highlight Inserts
Select one of the middle color maps.
Save this color map somewhere you can find it.
Open disk_out_ref.ex2.
Apply
-X
Select Clip filter.
Apply.
Turn off the Show Plane check box.
Select variable Temp
Open the Color Map Editor.
Open the presets dialog.
Import.
Select the color map .xml file that you downloaded.
Advanced.
Now, select the new color map.
4.5. Opacity mapping
Leave the color editor open.
Open can.ex2.
Apply.
+Y
Go to last timestep.
Set Coloring to Accl.
Go to first timestep.
Choose a black body palette.
Enable opacity mapping for surfaces.
Play
Filters → Alphabetical → Pass Arrays.
Apply.
Change this filter to be wireframe, solid color. Opacity 0.1.
Back on can.ex2, turn visibility on.
Click on and change the opacity transfer function.
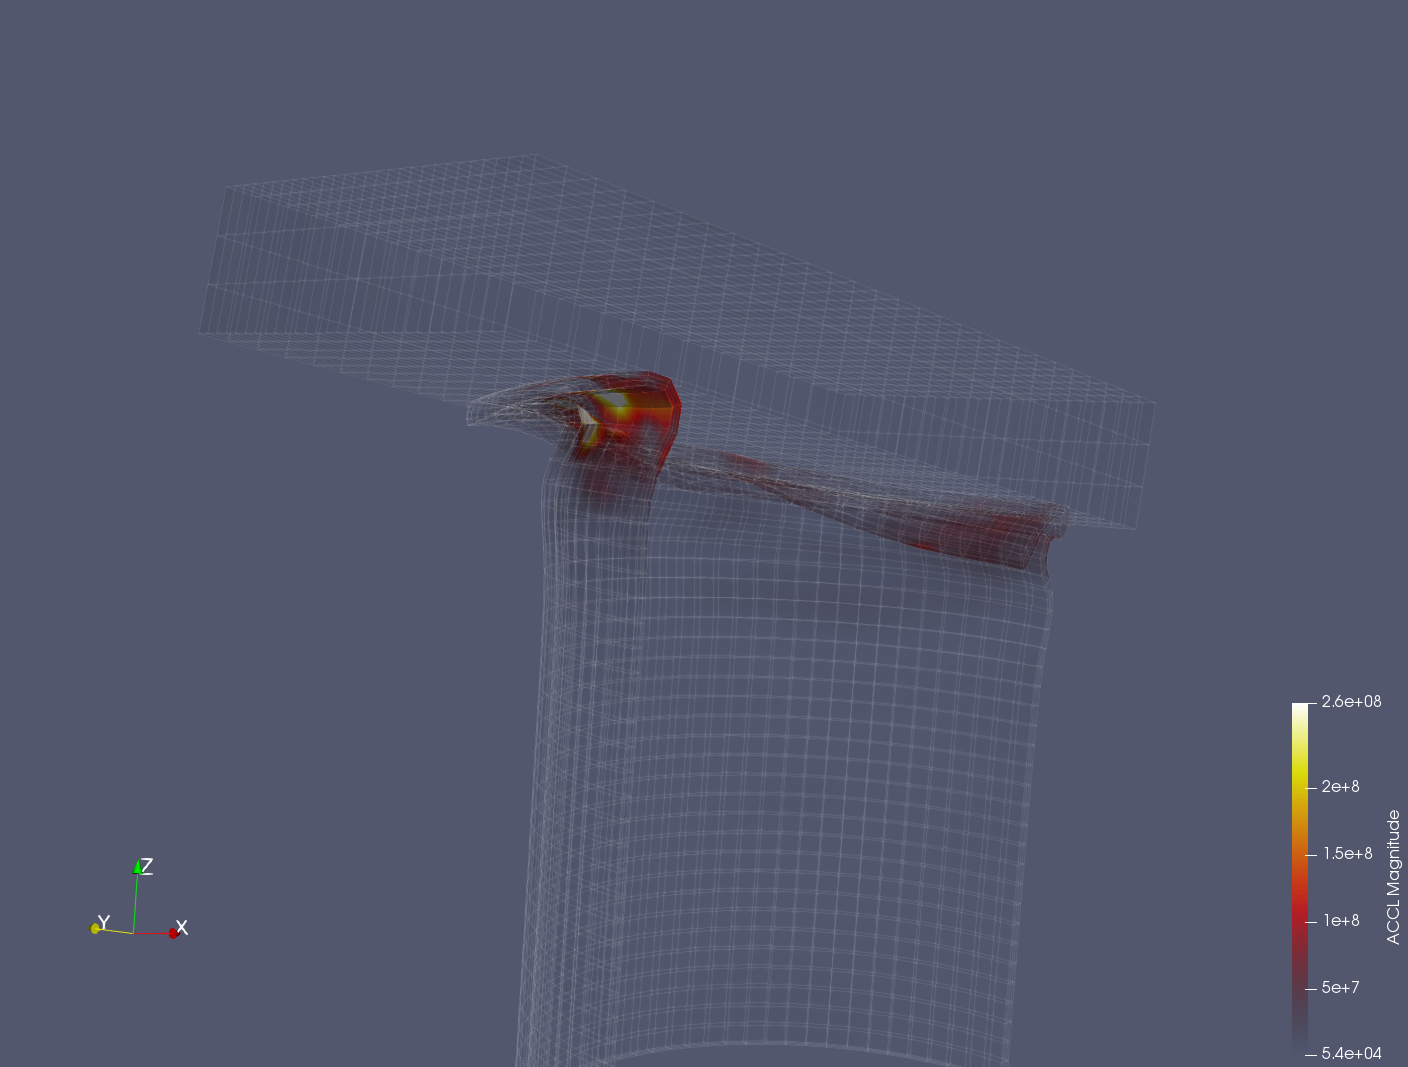
Turn off the enable opacity mapping for surfaces.
Volume render.
Play