8. Advanced: Data Analysis
8.1. Introduction
This tutorial covers data analysis.
8.2. Find Data Panel
The Find Data panel is used to:
Select points or cells.
Show the data for these points or cells.
Control label display on your data in the 3d view.
Shortcut to run data analysis filters.
We will explore this panel using an example.
Open a dataset and the Find Data panel.
Open can.ex2.
Apply.
Edit → Find Data. You can also open the Find Data panel using the icon

We will select an ID.
Set Data Producer to can.ex2.
Set Element Type to Cells.
Change pulldown to ID. Leave as is. Enter 100.
Only select block_1
Find Data
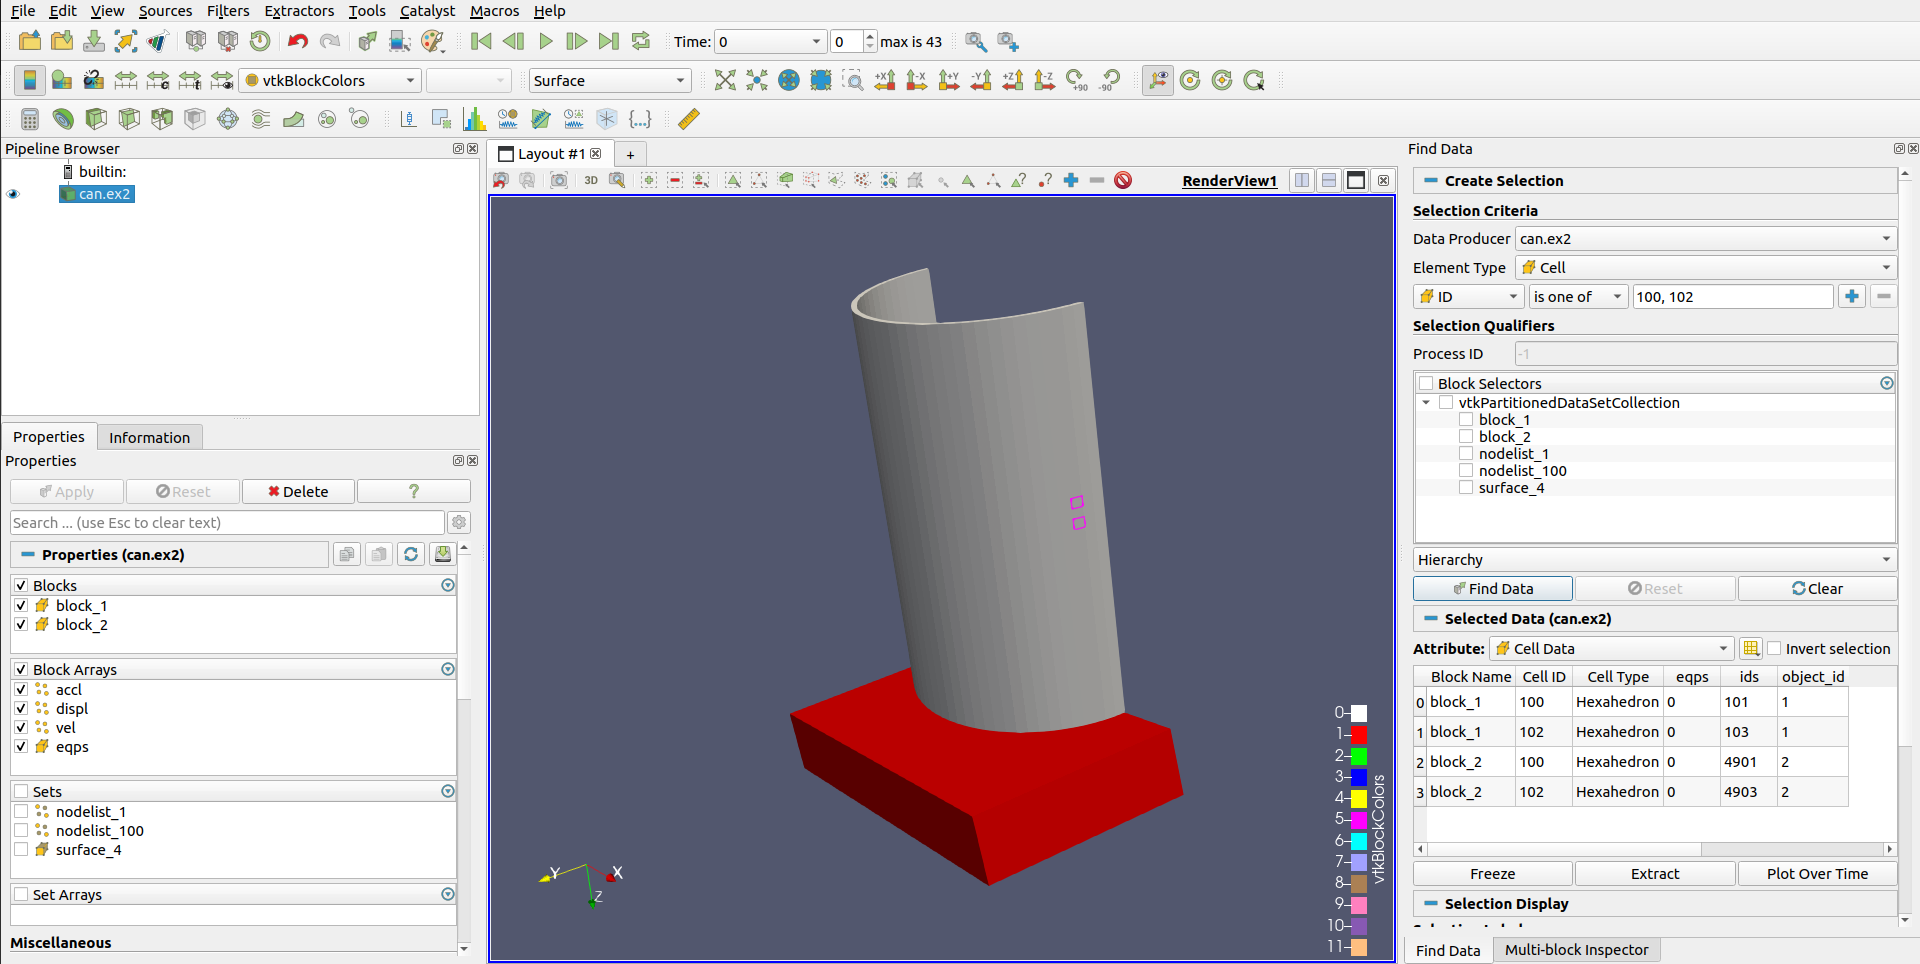
We will select two IDs.
Find Cells from can.ex2
Change pulldown to ID. Change to is one of. Enter 100, 102.
Find Data
We will select the maximum EQPS.
Move forward one timestep. EQPS for timestep 0 is all the same - 0.
Set Data Producer to can.ex2.
Set Element Type to Cells**.
Change pulldown to EQPS. Change to is max.
Find Data
Play forward
Notice that the data for the selected cell (or point) is displayed in the spreadsheet.
If desired, the maximum (or minimum) cell can be found, and this selection can be frozen. The same cell will then be selected for all timesteps. Use the Freeze Selection button to freeze selections.
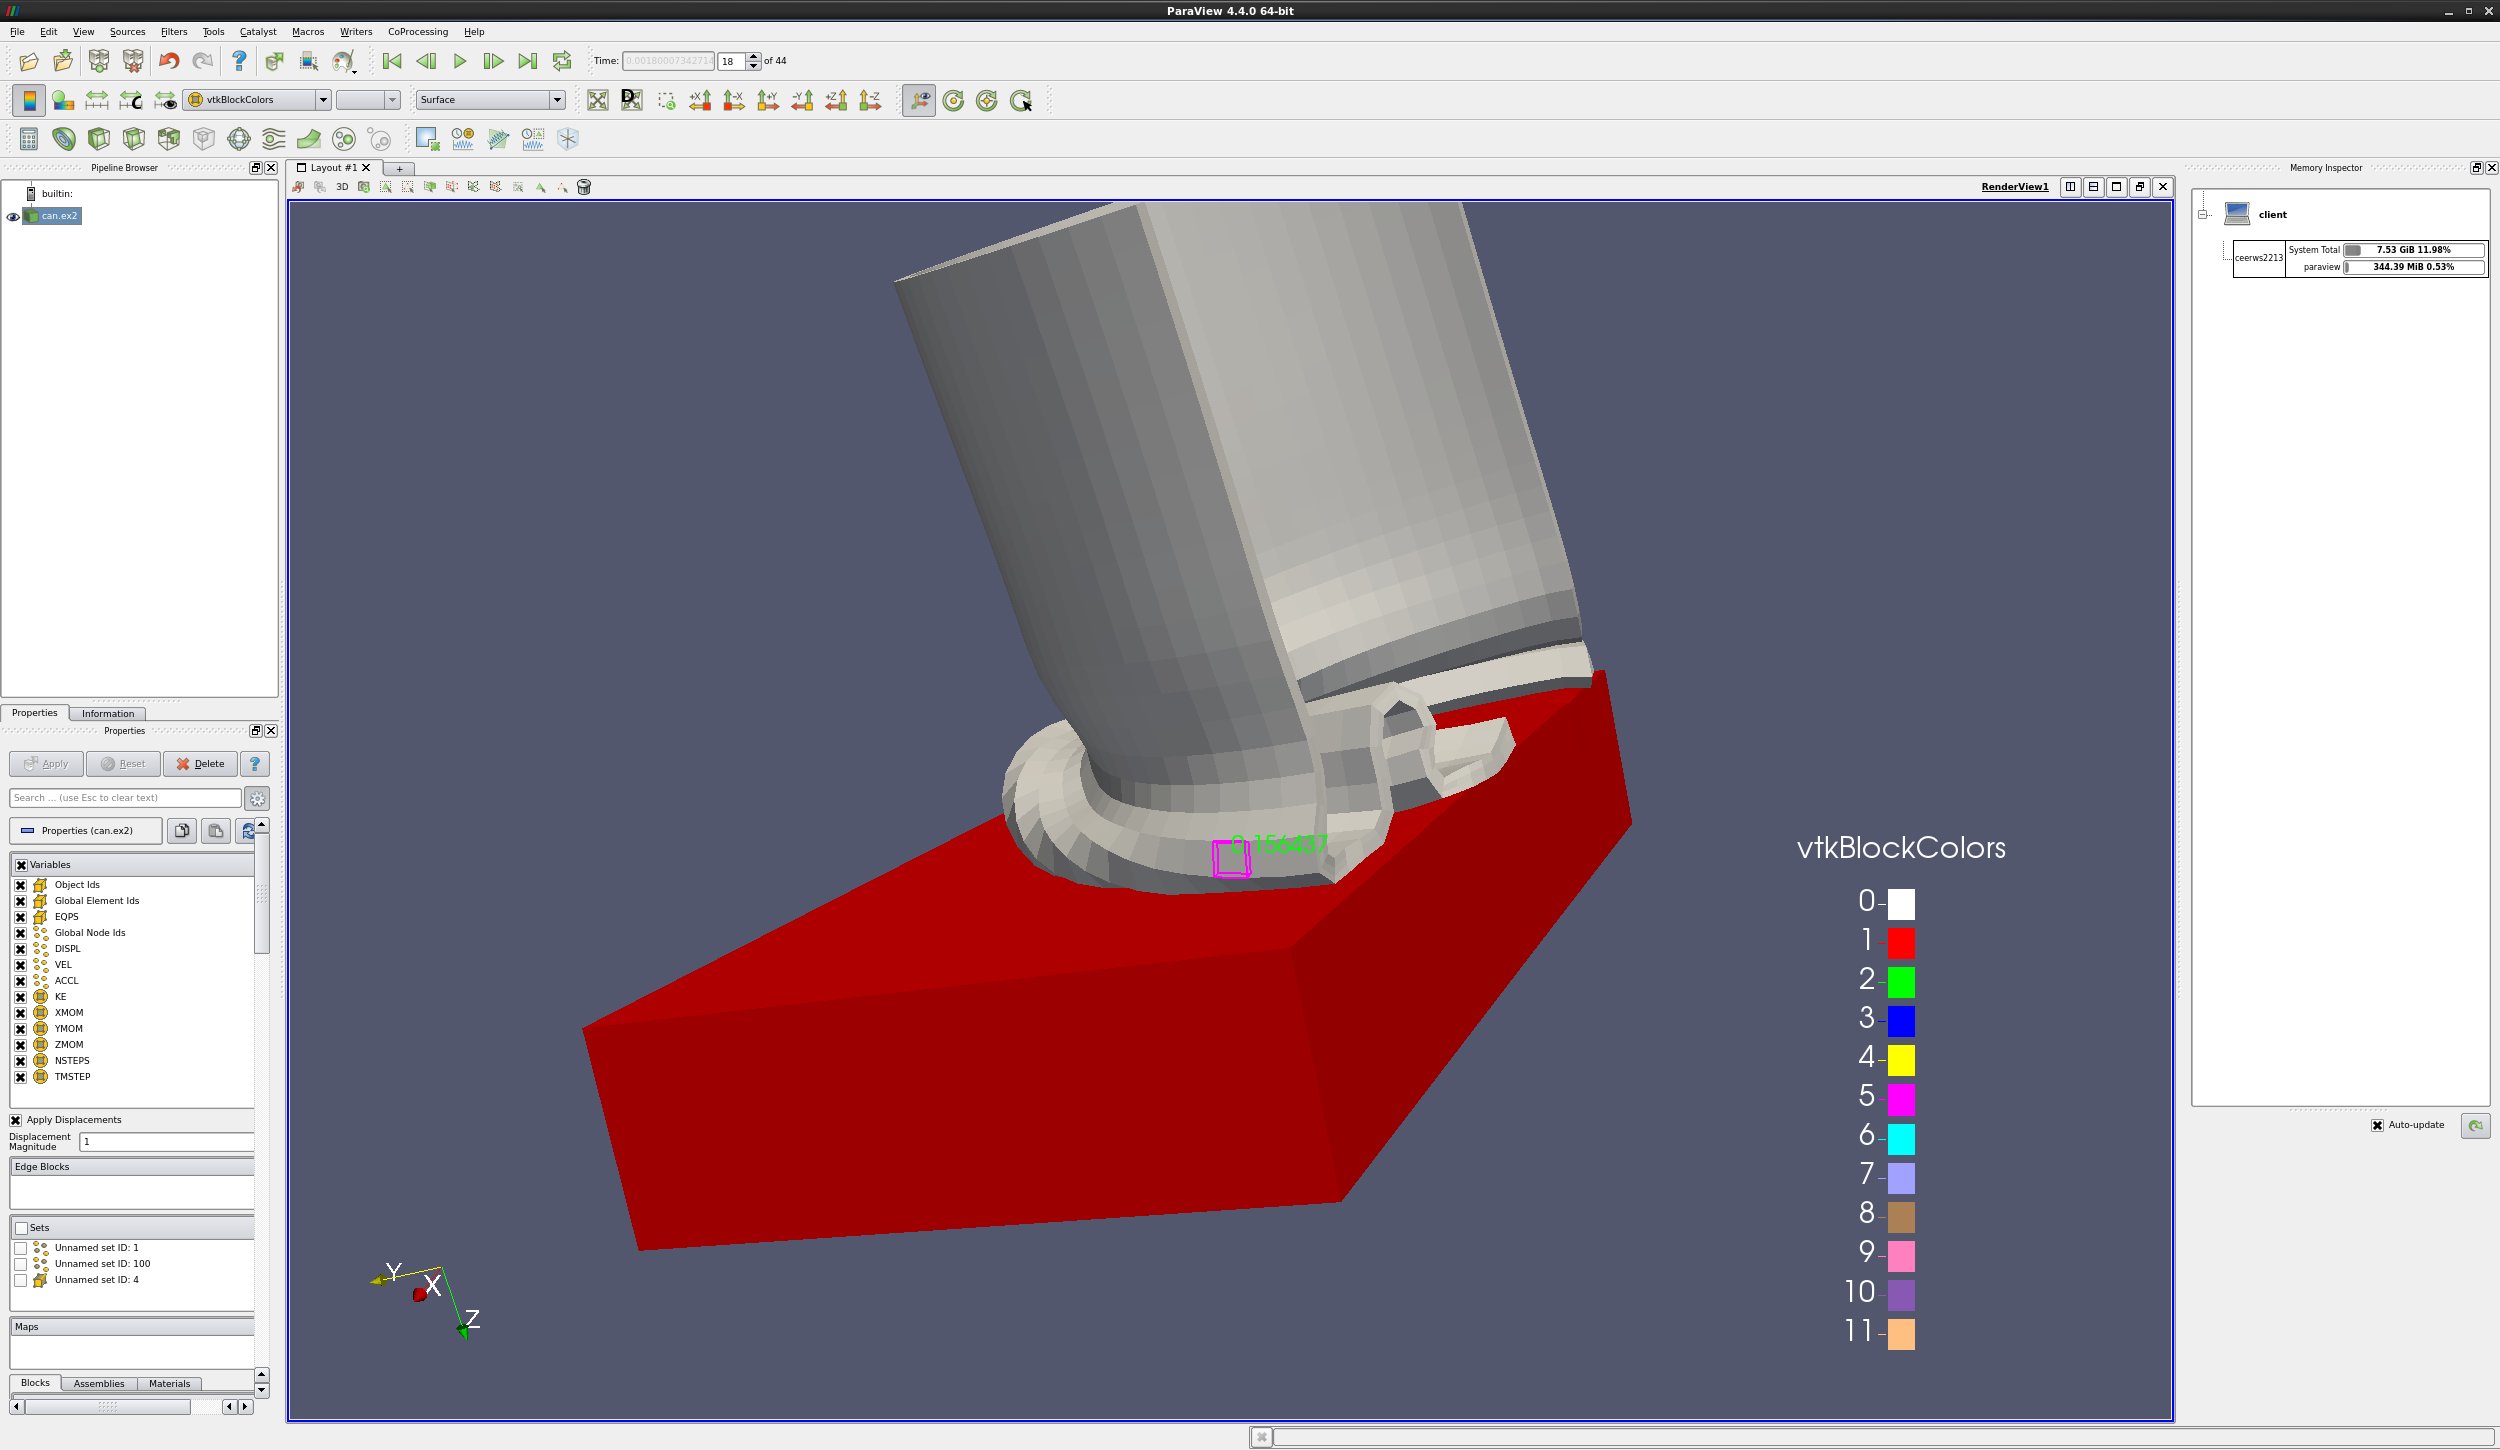
We can also display cell or point data on the 3d view. This is done with Cell Labels and Point Labels.
Open the Cell Labels pulldown, and select EQPS.
8.3. Cell, Point and Block Selections in Render View
paraview has a very powerful group of selection tools. Selections are
found as a group of icons in the upper left corner of the 3d view.
More than one selection can be active at a time. Use the CTRL key. You can also use the Add Selection, Subtract Selection and Toggle Selection icons.
Variable data can be printed on the screen for any cell that is selected. See the section on Find Data.
Selections can be used as input to numerous Data Analysis filters.
Select Cells On. Select one or more cells on the surface of your object. Either a single click or rubber band select works. Shortcut - s.
Select Points On. Select one or more points on the surface of your object. Either a single click or rubber band select works. Within a tolerance, the nearest point will be selected. Shortcut - d.
Select Cells Through. Select cells through your dataset. This is known as a Frustum select. Shortcut - f.
Select Points Through. Select points through your dataset. This is also known as a Frustum select. Shortcut - g.
Select Cells With Polygon. Select cells on the surface of your dataset by drawing a polygon. No shortcut.
Select Points With Polygon. Select points on the surface of your dataset by drawing a polygon. No shortcut.
Select Block. Select one or more blocks. Either click or rubber band select works. Shortcut - b.
- Interactive Select Cell Data On. If your dataset is colored by a
cell data array of type
idtype, interactively select all cells in that dataset with the same value as the cell under the cursor. No shortcut.
- Interactive Select Point Data On. If your dataset is colored by a
point data array of type
idtype, interactively select all points in that dataset with the same value as the point under the cursor. No shortcut.
Interactive Select Cells On. Interactively select cells on the surface of your dataset. If you click on a selection, it will become permanent. You can have numerous permanent selections. No shortcut.
Interactive Select Points On. Interactively select points on the surface of your dataset. If you click on a selection, it will become permanent. You can have numerous permanent selections. No shortcut.
Hover Cells On. This will display all of the data available on this cell. Interactive.
Hover Points On. This will display all of the data available on this point . Interactive.
Grow Selection. This will grow selection to include any cell touching a previously selected cell.
Shrink Selection. This will remove the selection of any cell touching an unselected cell.
Clear Selection.
8.4. Spreadsheet and histogram view
paraview can visualize data in a spreadsheet view. The spreadsheet view
can be configured to show all data, or only selected data. You can also
select a row in the spreadsheet view and it will be selected in the 3d
view.
You can also show your data as a histogram. This will show you how many cells have different attributes.
Open can.ex2.
Apply.
Highlight the can window, and Select Cells On on the can.
Split Horizontal.
Split Vertical.
In the upper right window, select Spreadsheet View.
Select the Show Only Selected Elements check box (next to Precision).
Note that the Spreadsheet can now be sorted - including in parallel.
Select a different cell on the can.
Highlight the lower right window.
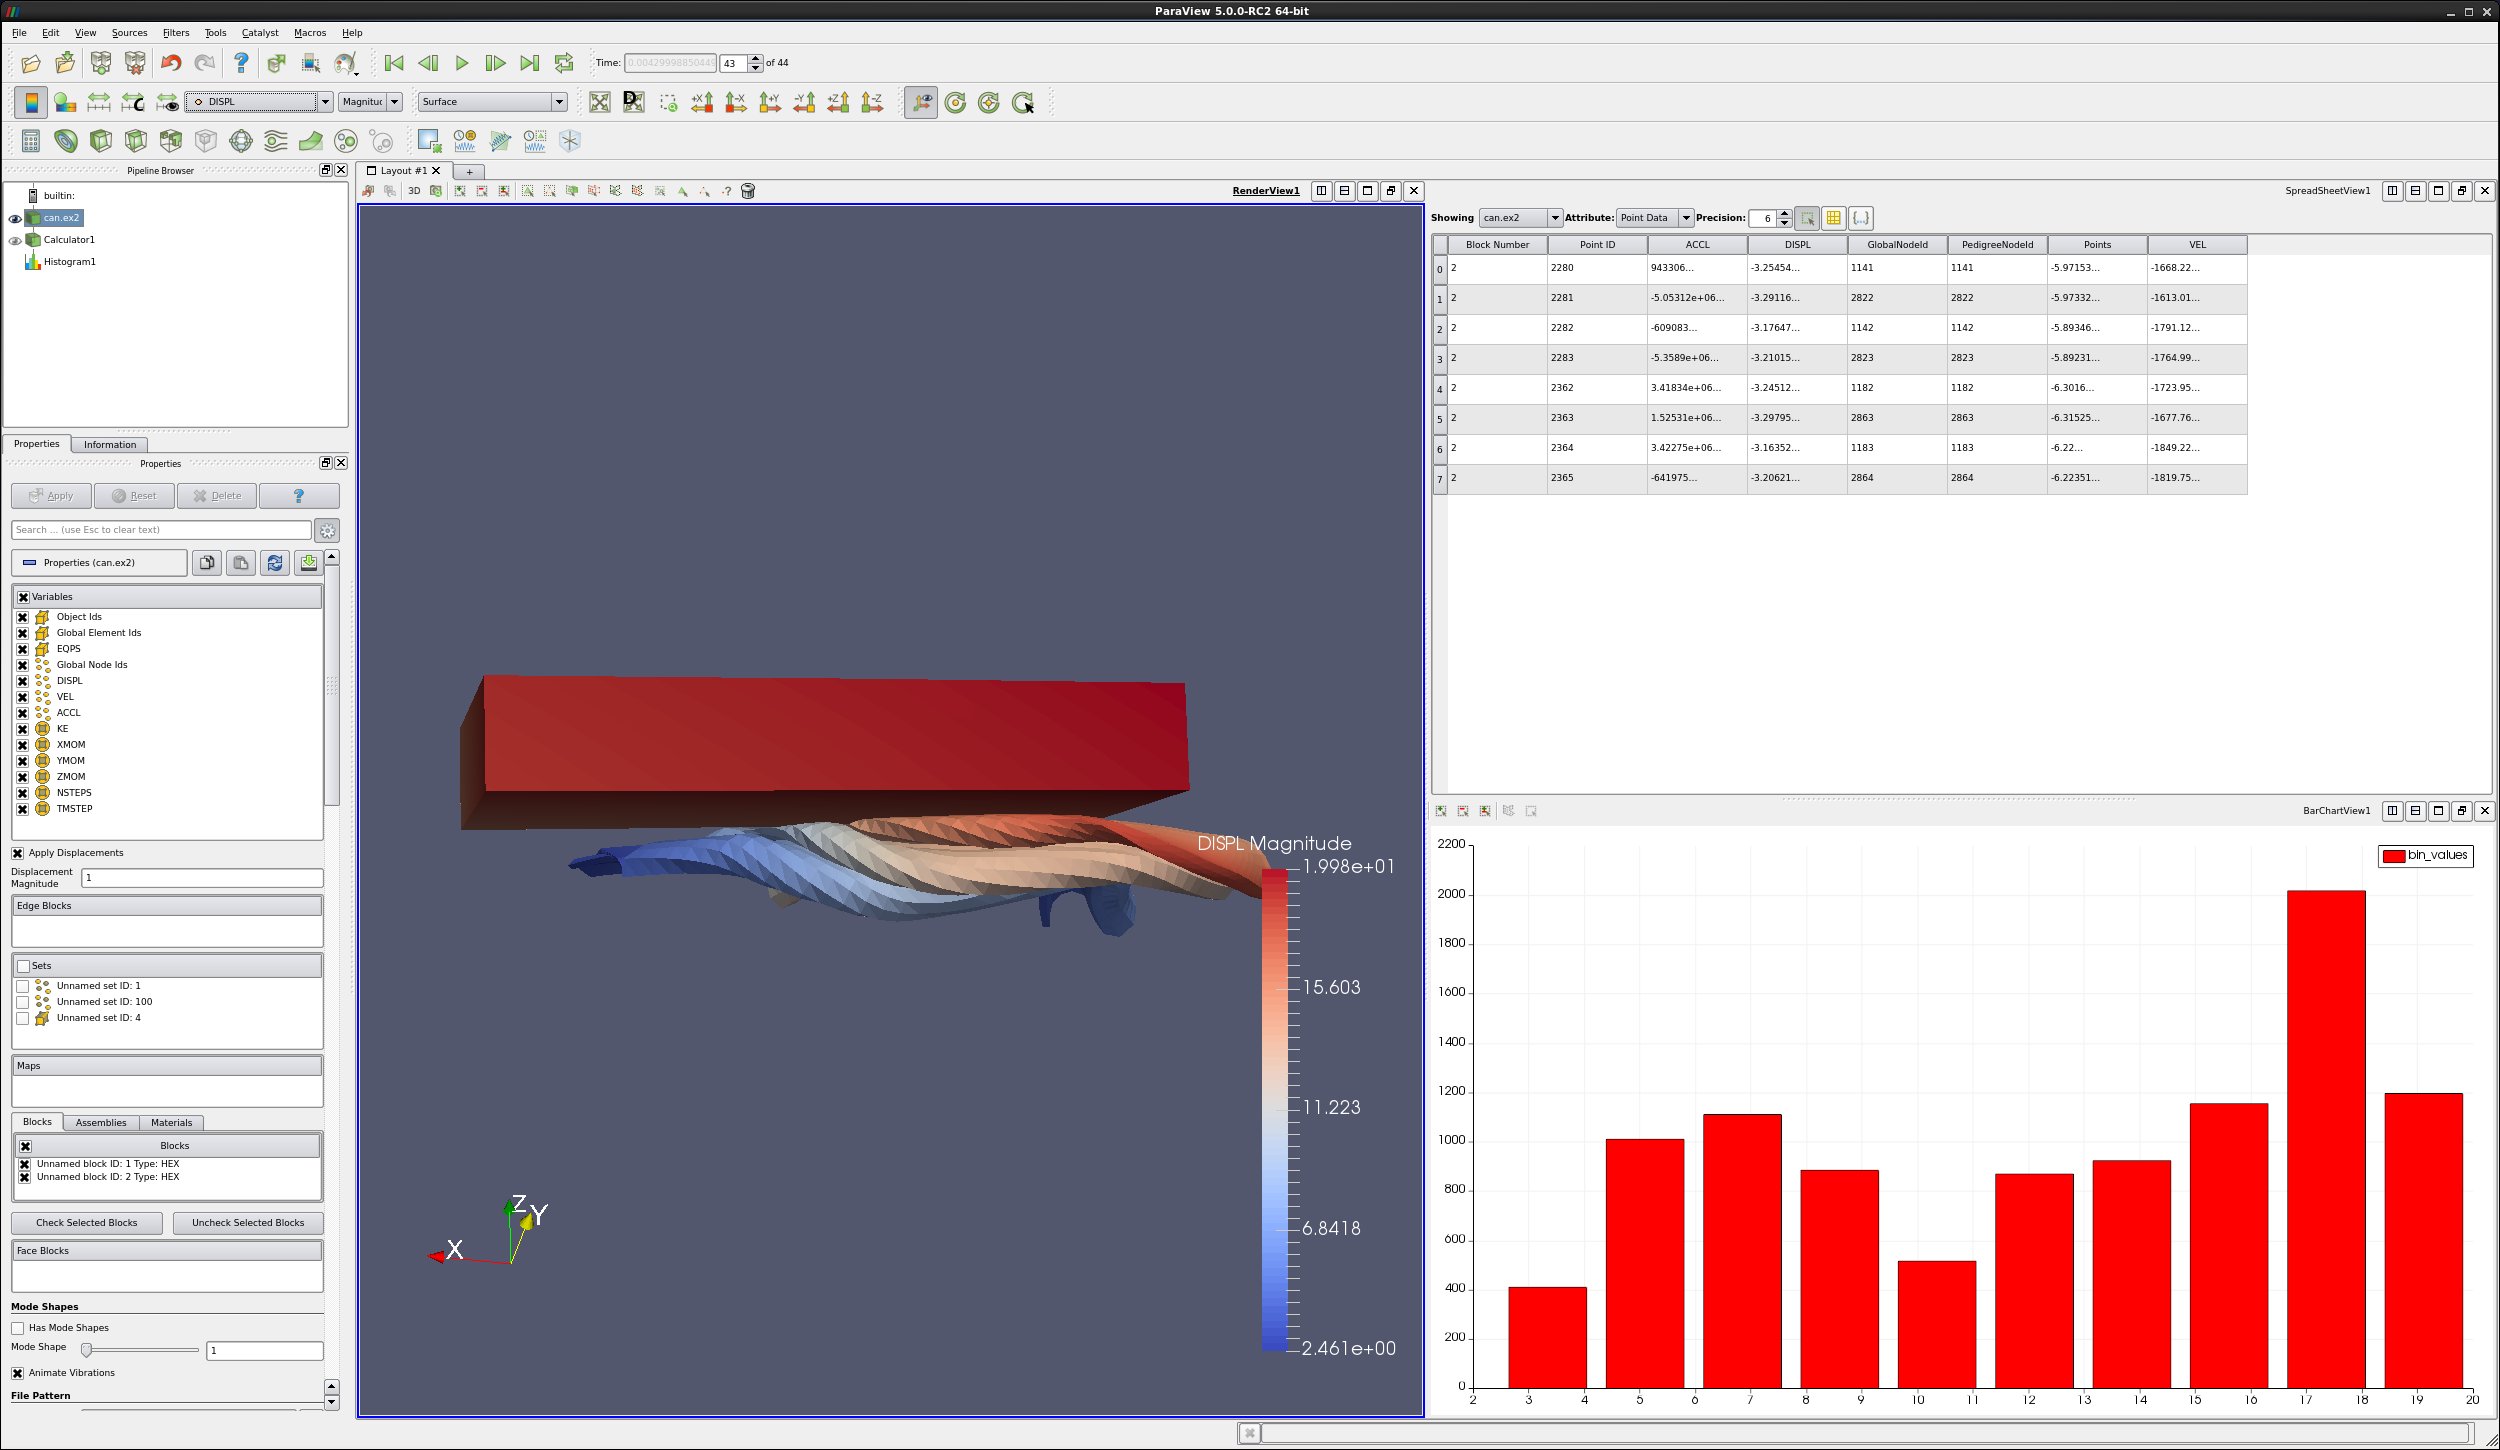
We want magnitude of the DISPL vector.
Select Filters → Common → Calculator.
Set Expression to mag(DISPL). Result Array Name → MagDispl.
Apply.
Filters → Data Analysis → Histogram.
Apply.
Close the 3d RenderView
Change Select Input Array to MagDispl.
Apply.
Animate forward in time one step at a time.
Play.
If desired, freeze the X and Y axis in the Properties tab using Axis Use Custom Range.
8.5. Advanced Spreadsheets
You can either display all of your dataset’s points or cells in your spreadsheet, or only those that are selected in the 3d view. With the spreadsheet window selected, in the Properties tab, click Show only selected elements.
When cells or points are selected in the 3d RenderView, the appropriate row(s) in the spreadsheet view will be highlighted.
Highlighting works both ways - if you select a row or rows in the spreadsheet view, the cell or point on your dataset will be selected.
You can select multiple rows in the spreadsheet by holding down the CTRL key, and can select ranges of rows by holding down the SHIFT key.
Note: The Spreadsheet can be sorted.
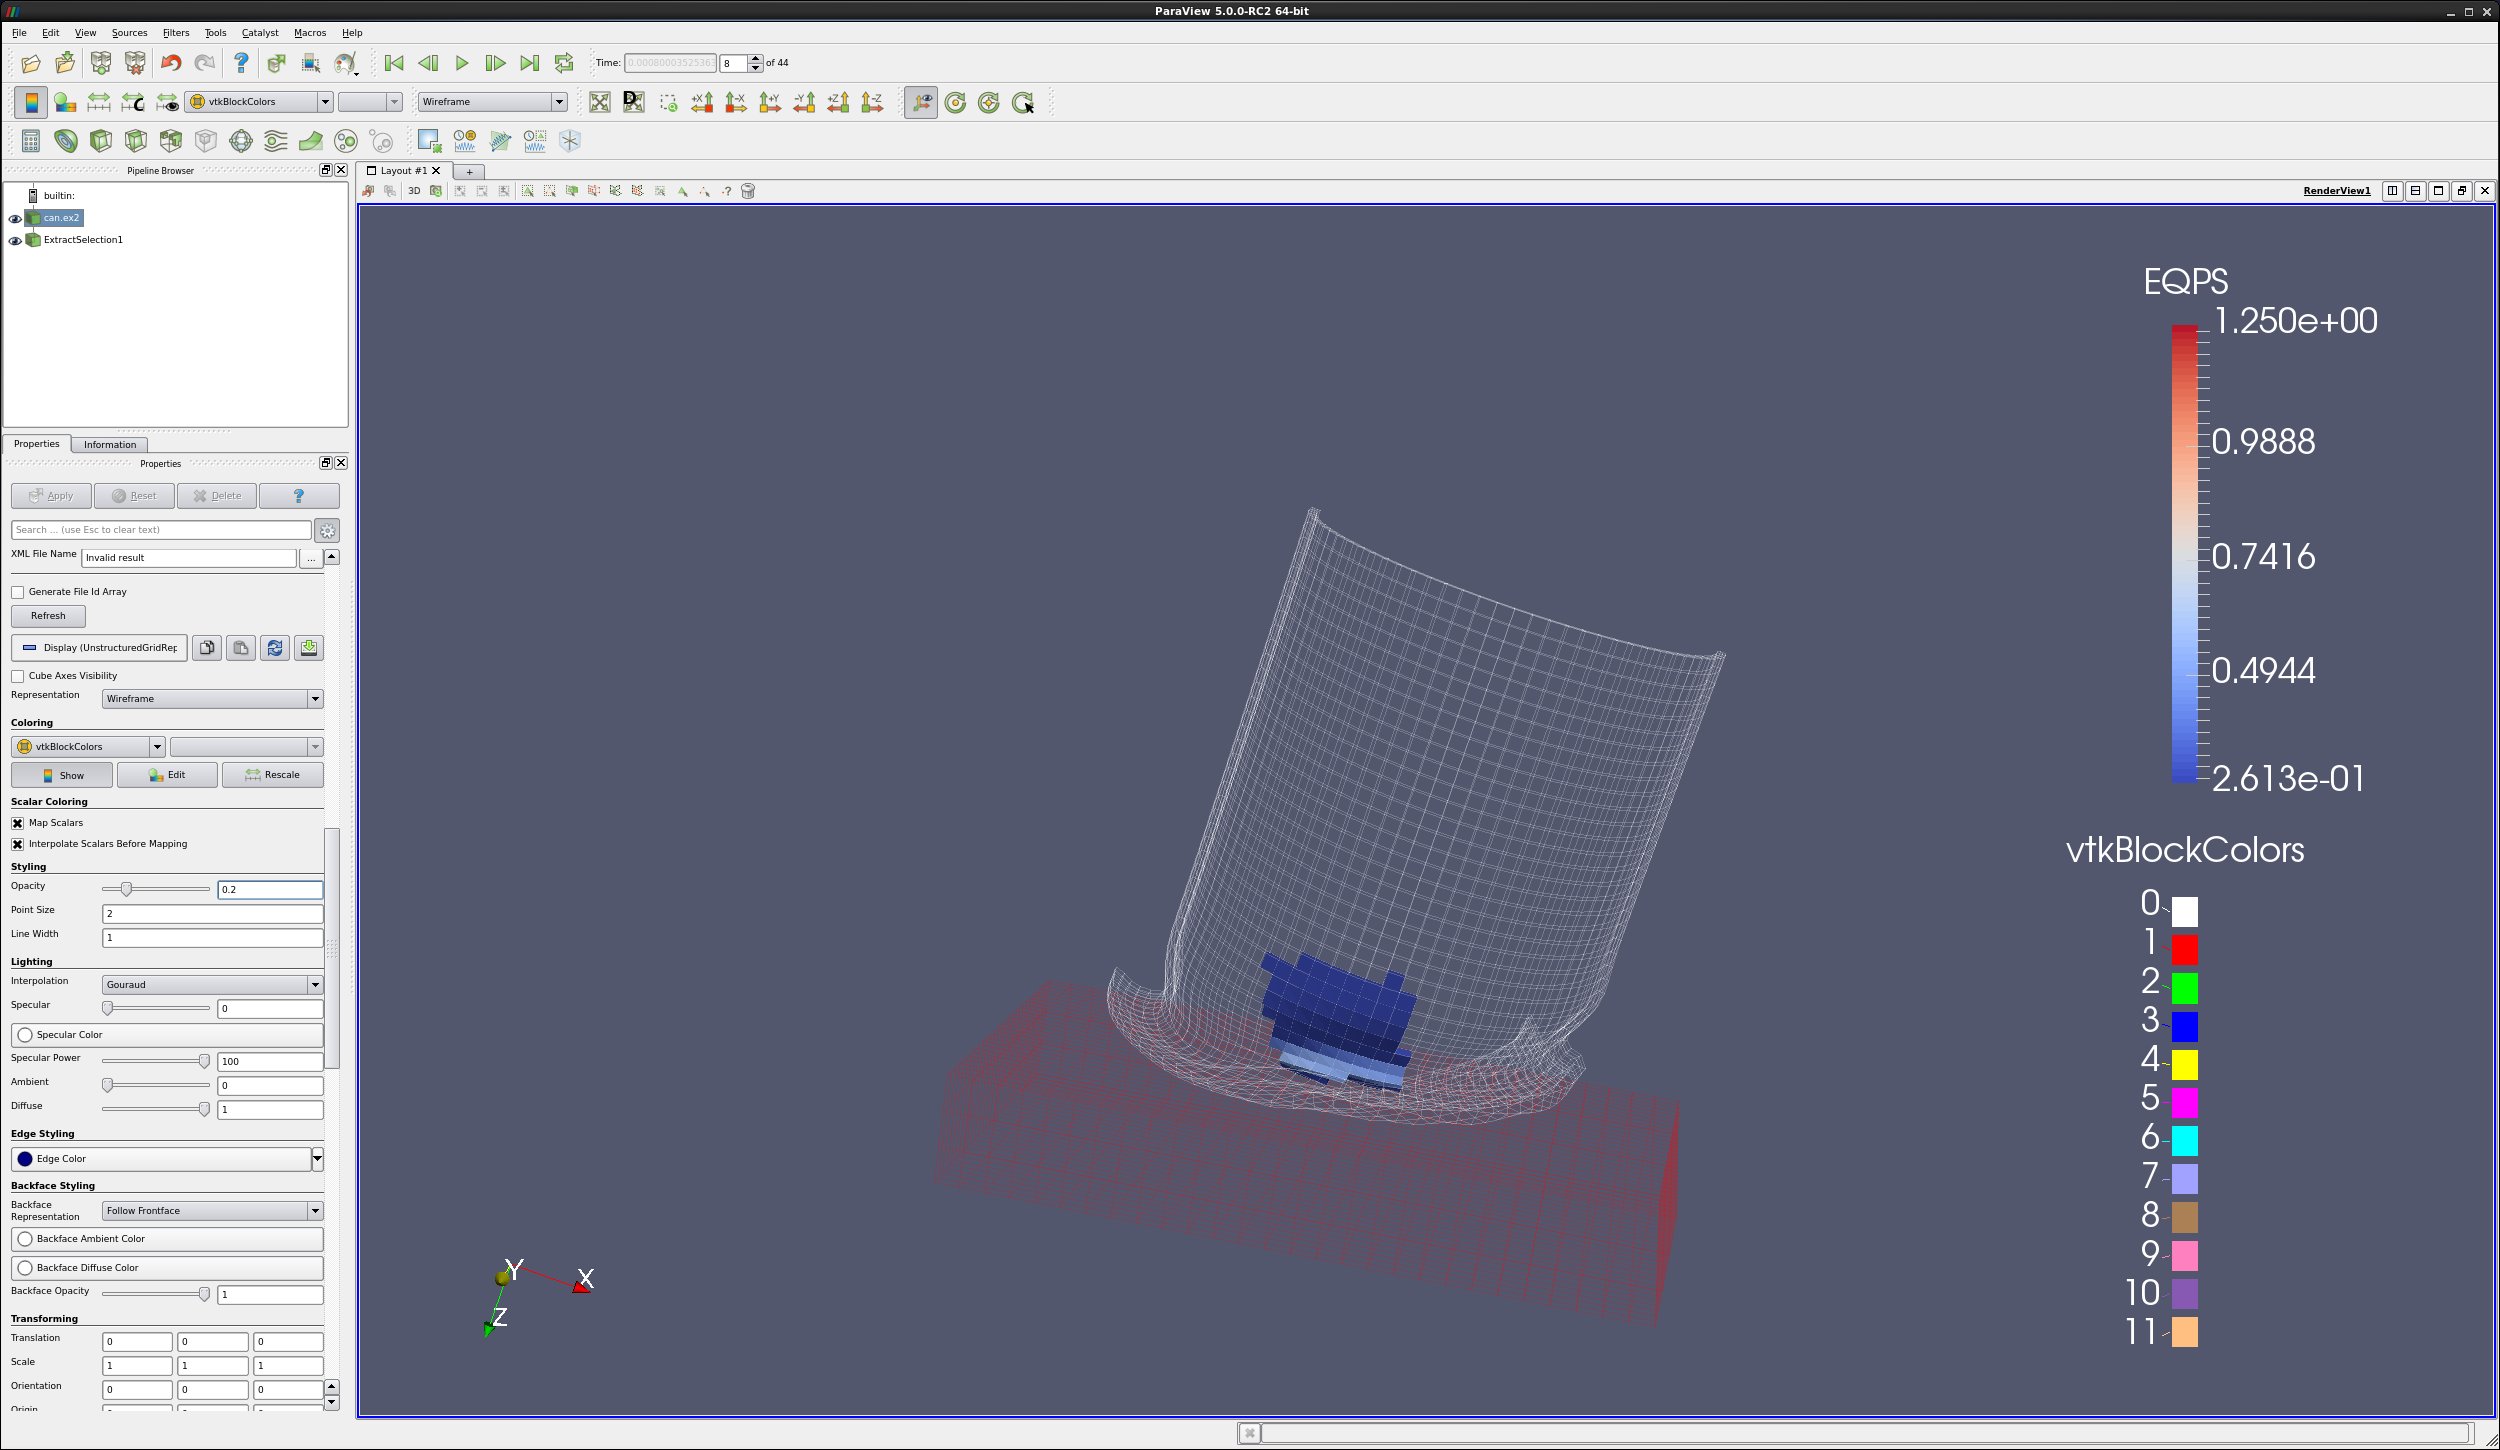
8.6. Extract Selection
Open can.ex2.
Using the Select Cells Through icon, select a few dozen cells.
Open the Find Data dialog
Click Freeze Selection. That way, we don’t have the can moving out of the frustum over time.
Click Extract Selection in the Find Data panel.
Apply.
Did you know?
The Extract Selection is also found under Filters → Data Analysis.
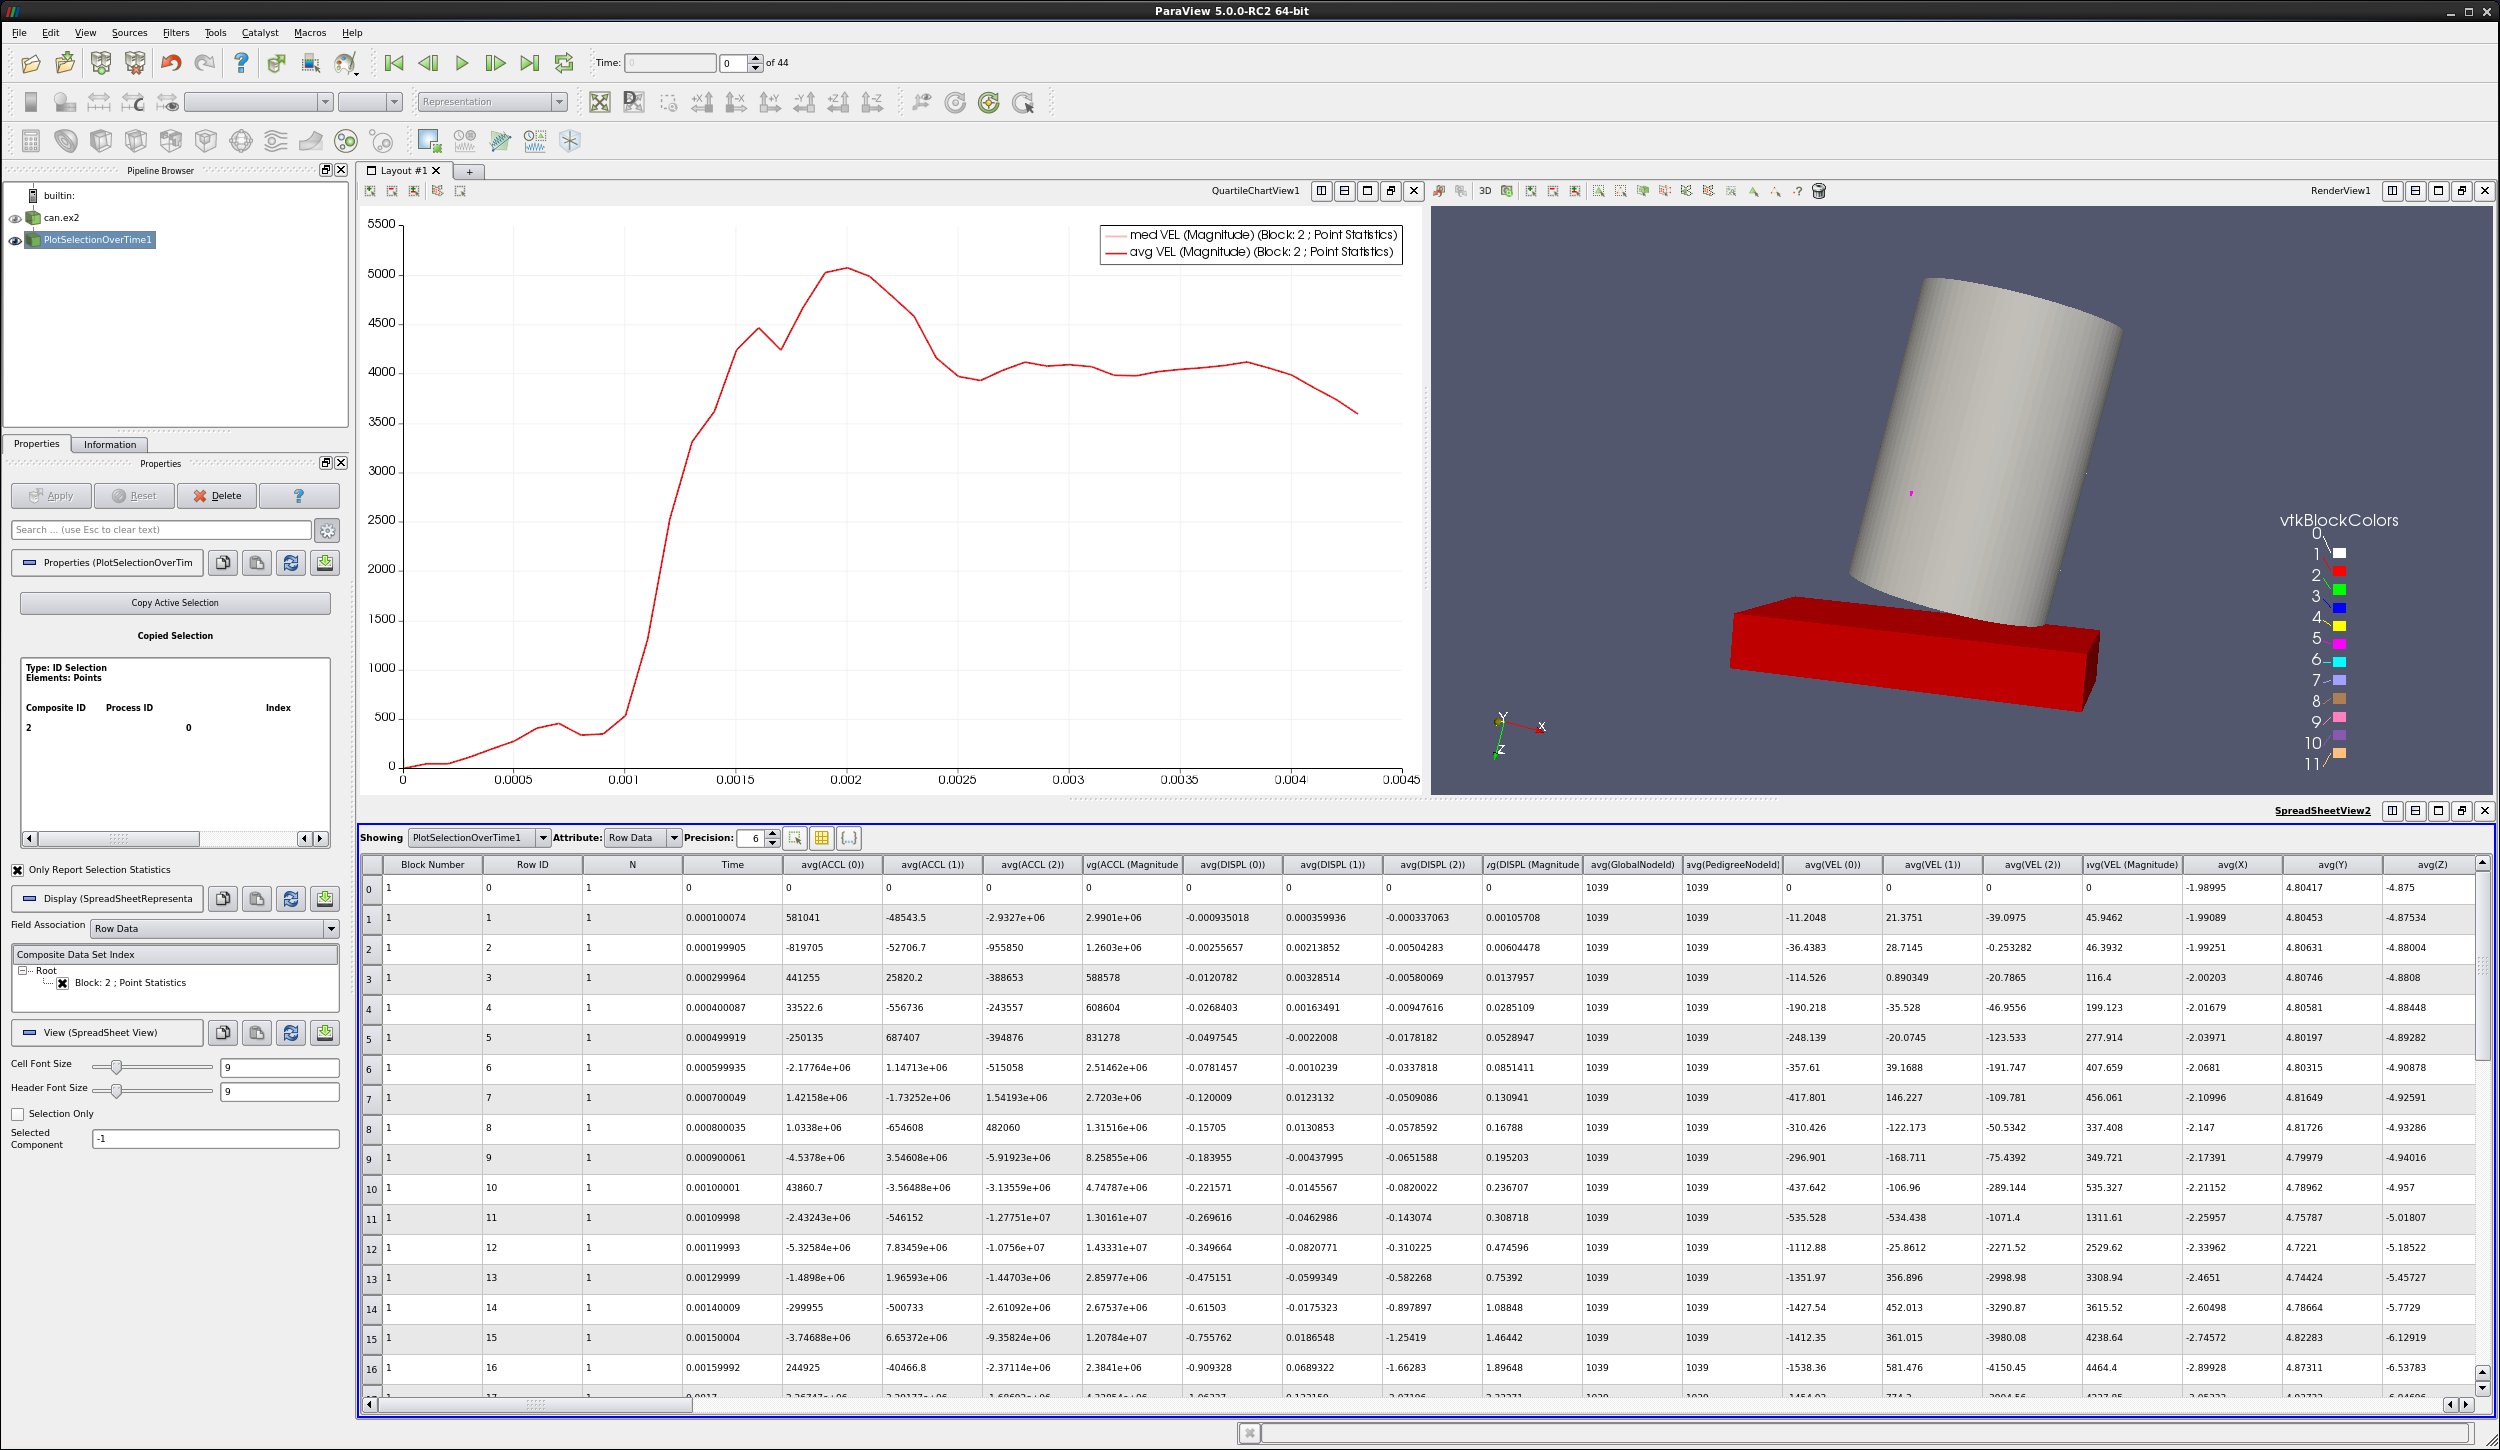
8.7. Spreadsheet data by time
Open can.ex2.
On the toolbar, click the Select Points On icon. This will allow you to manually select a point on your data set.
Select a point on your dataset.
Filters → Data Analysis → Plot Selection Over Time.
Apply.
Split Vertical, Spreadsheet View, and with the Spreadsheet View highlighted, turn on the eyeball in front of the Plot Selection Over Time filter.
Did you know?
You can write spreadsheet data out to a .csv file using File → Export.