1. Beginning: ParaView
1.1. Introduction
This tutorial will describe how to start paraview, find information and
help about paraview, and describe some of the more important controls
used by ParaView.
The ParaView web site is located at https://www.paraview.org. New
versions of paraview can be found here, along with different tutorials
and advice. ParaView versions include 32 and 64 bit versions of Linux,
Windows and Mac OS X. Training (practice) data is included in all ParaView
downloads, and can be accessed through File → Open → Examples.
Did you know?
paraview now has an integrated help. It is found under the menu item Help → Help.
1.2. A simple example
1.2.1. Start ParaView
On Windows, go to Start → All Programs → ParaView x.x.x → and click ParaView.
On Mac, in the finder, go to the ParaView directory (in the Application directory where you installed ParaView) and click on paraview.
On Linux go into the ParaView directory (where you downloaded ParaView), then bin and type paraview.
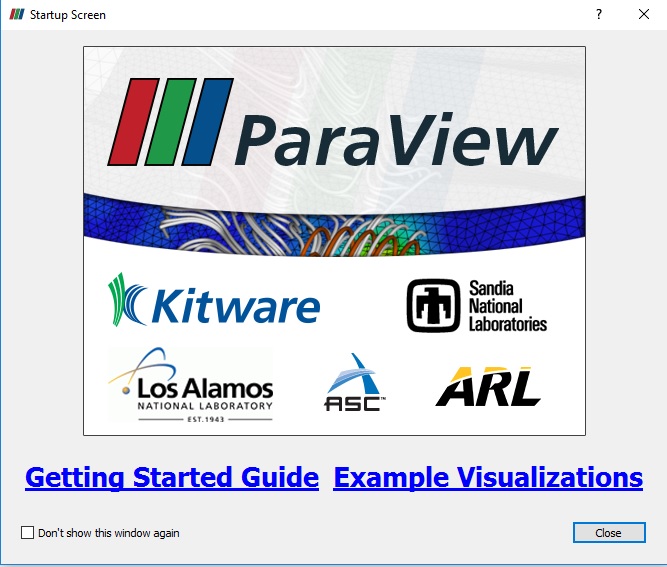
1.2.2. Startup Screen
The Startup Screen includes two important links. Both of these links can also be found from the Help menu. They are the Getting Started Guide and Example Visualizations.
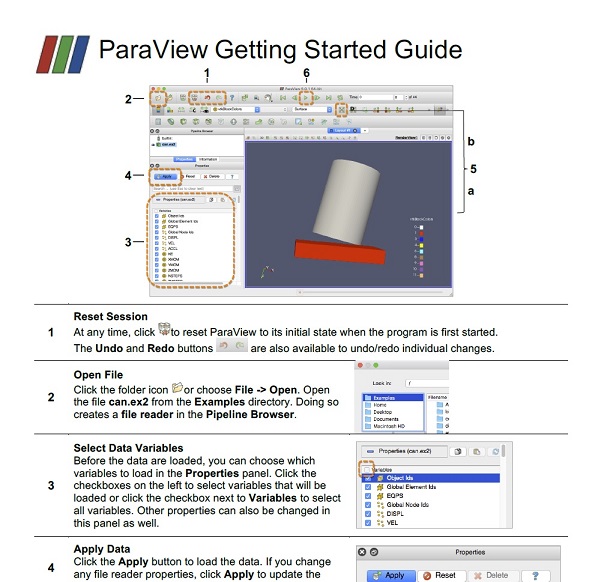
1.2.3. Getting Started Guide
The Getting Started Guide is a two page mini tutorial that shows fundamental ParaView usage.
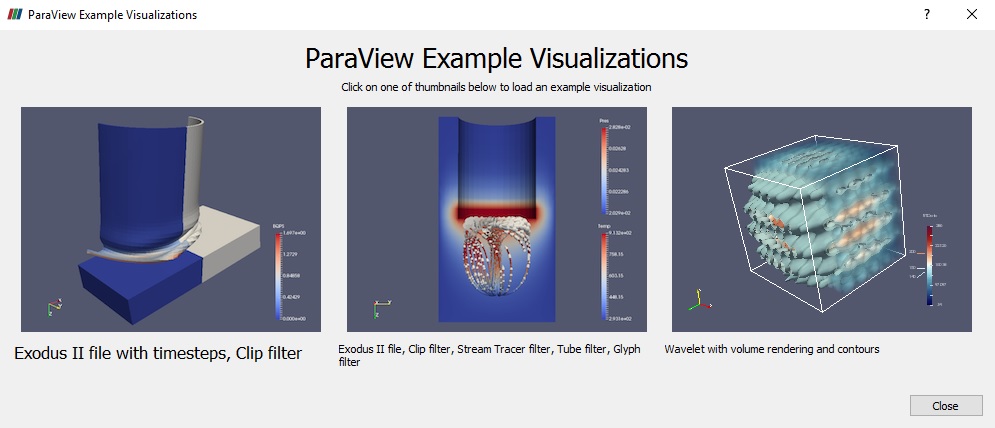
Example Visualizations provide three finished visualizations. You can then play around with a ParaView pipeline.
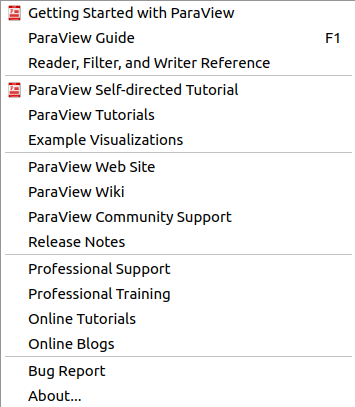
1.2.4. Help Menu
The Help menu looks like this:
1.2.5. Open can.ex2
Open can.ex2.
can.ex2 is one of the datasets included with ParaView in the Examples folder.
In
paraview, File → Open.In the upper left corner, there is a folder called Examples. Go into this folder.
Select can.ex2.
OK.
Under the Properties tab, all Block Arrays will be selected.
Apply.
Turn off the node variables for ACCL. Since any variable that is selected takes up memory, and since some datasets are huge, often the user will only read in the data that is needed for a run.
Click ACCL, turning the check box OFF.
Apply.
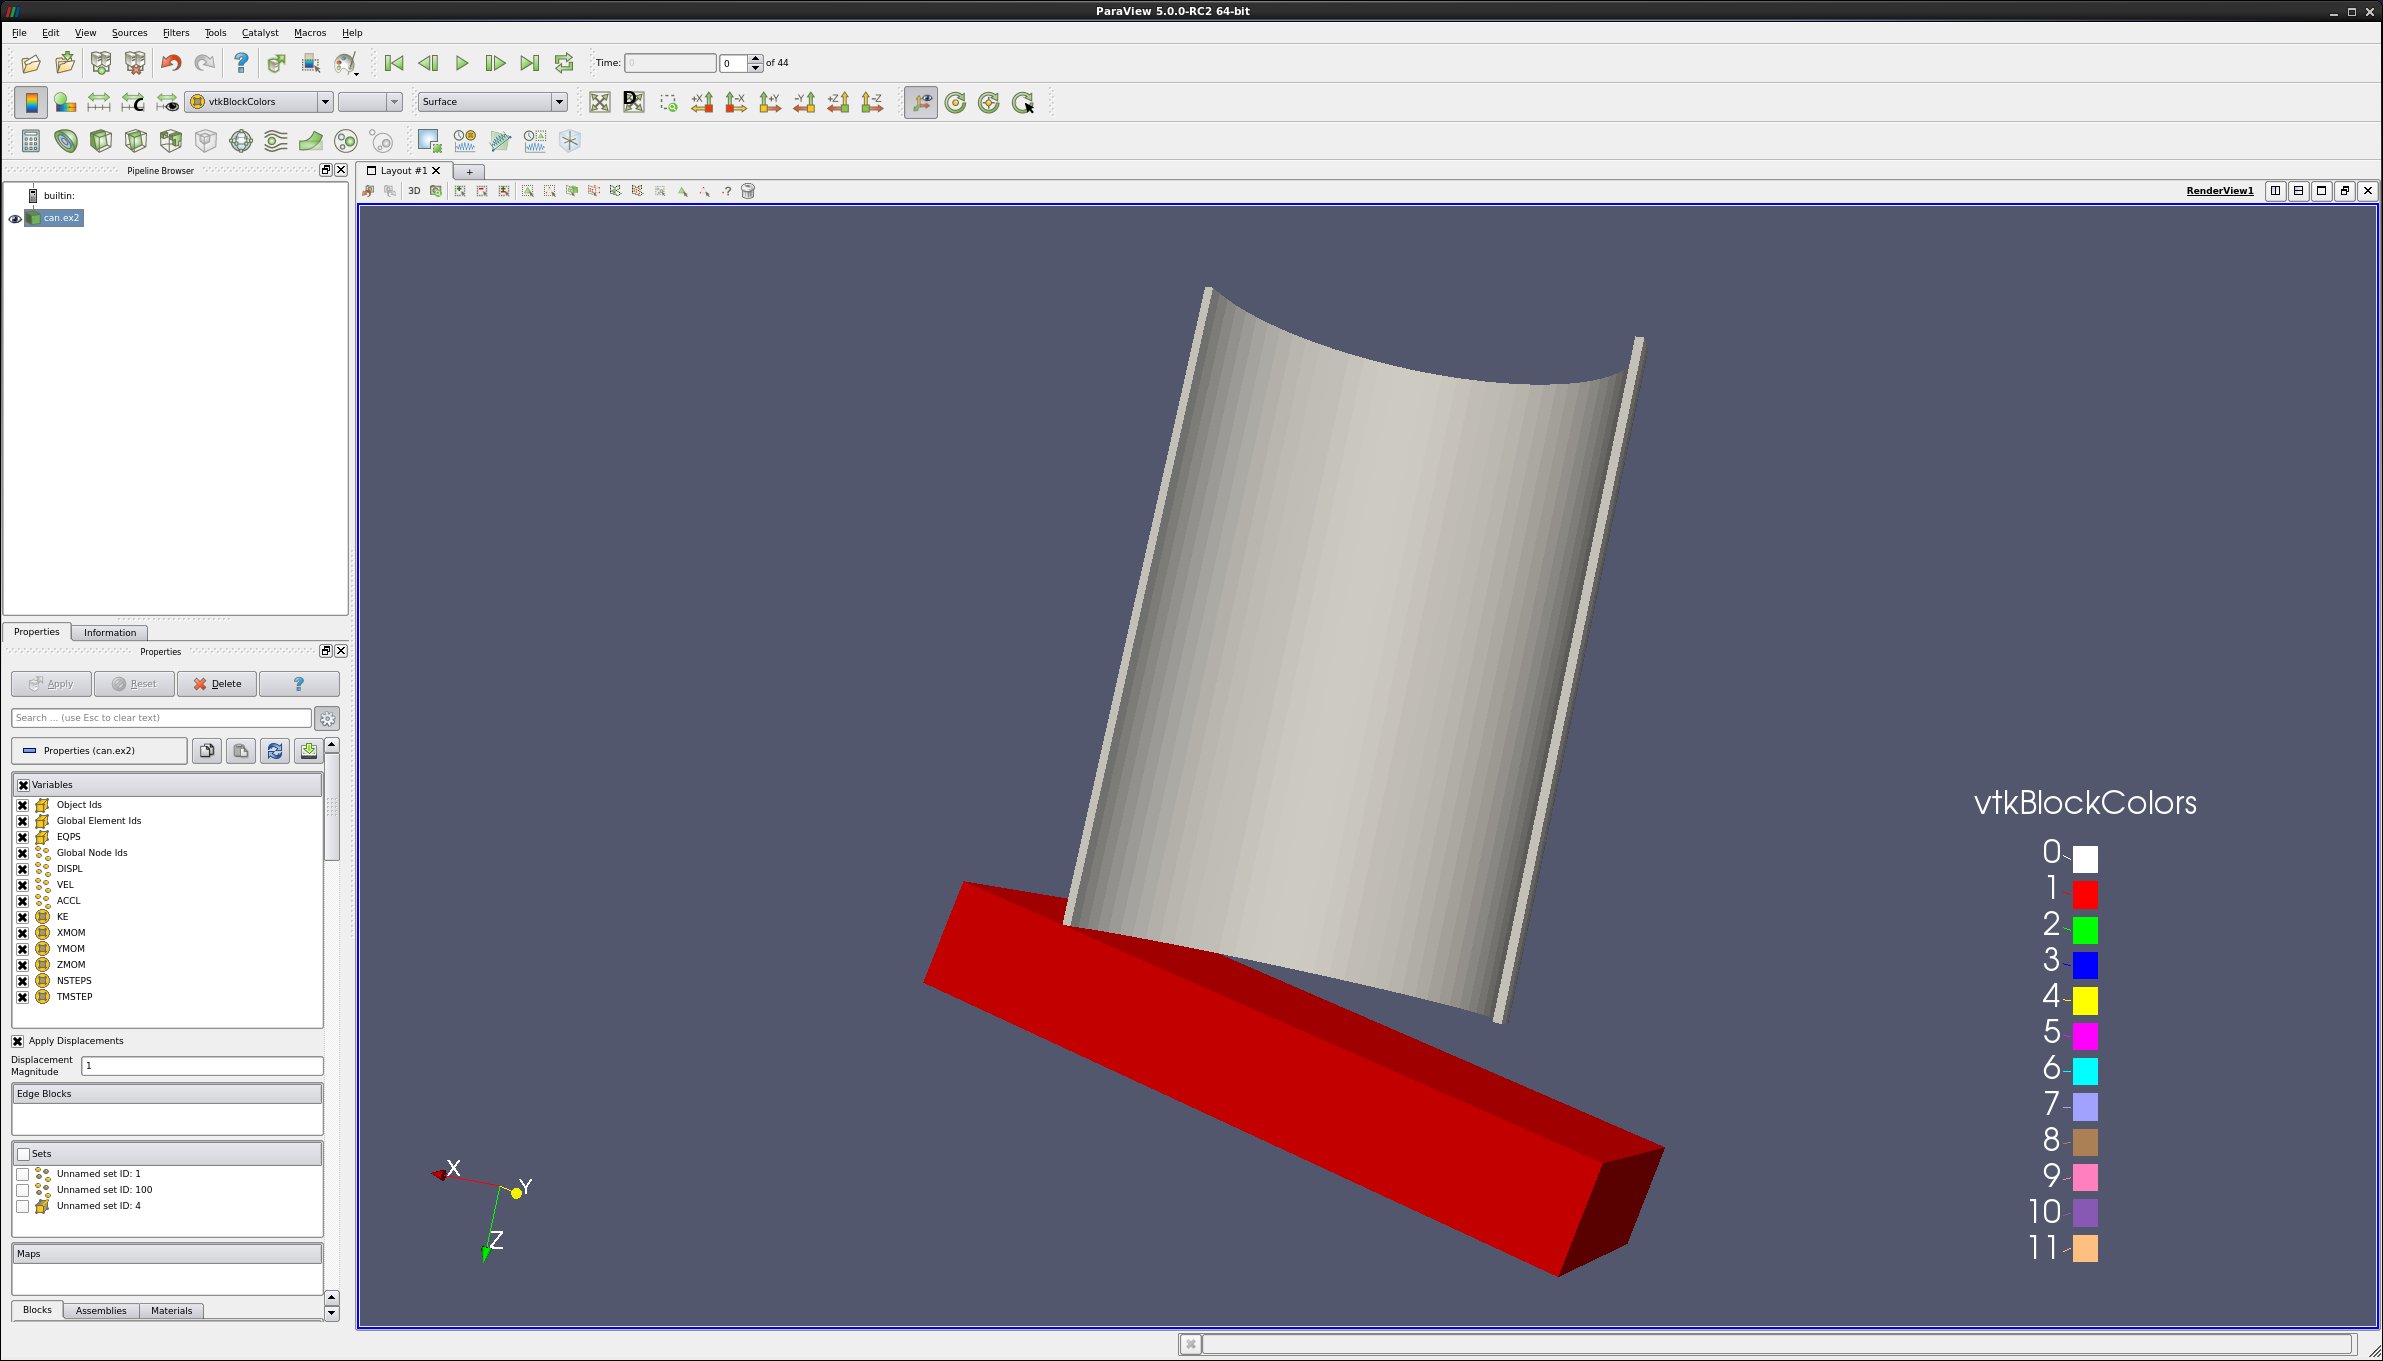
The screen should now look like this. (The square will show up as red, since ParaView defaults to coloring by block, and the block we are seeing is red.) You are looking at the bottom of the plate that the can is sitting on.

Lets move the 3d object. Grab the can using the left mouse button. Try the center button. Try again with the right button. Try all three again holding down the SHIFT key. Try again holding down the X, Y and Z keys.
Place your mouse on a corner of the can. Now, hold the CTRL key down, and move the mouse up and down. You can zoom into and out of that location.
Now the screen looks like this:
Notice that the can dataset is being painted in two colors -
To change the representation, change Surface to Wireframe (right below Help).
Then, change it to Surface with Edges.
Finally, turn it back to Surface.
Change the variable used for color. Change this from Solid Color to Displacement (Point DISPL). (This is found just below the Sources menu.) Everything should go blue.

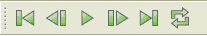
Animate the can one frame. Right above the window of the can are animation controls. Click the right arrow with a bar to its left once. The plate turns red.
Did you know?
The can dataset has displacement information in it. We are actually running the plate into the can, and the whole object is moving.
Notice that our color map is not set correctly. It needs to be set over the whole range of displacement, so that it grades from blue to red.
Be careful!
Very, very large data can take a long time to process. Don’t animate your data unless you have to with very large datasets.
Click the single right arrow, running to the end of the simulation.
Click the Rescale to Data Range button.
Rewind using the animation control furthest left arrow, then click the single right arrow again.
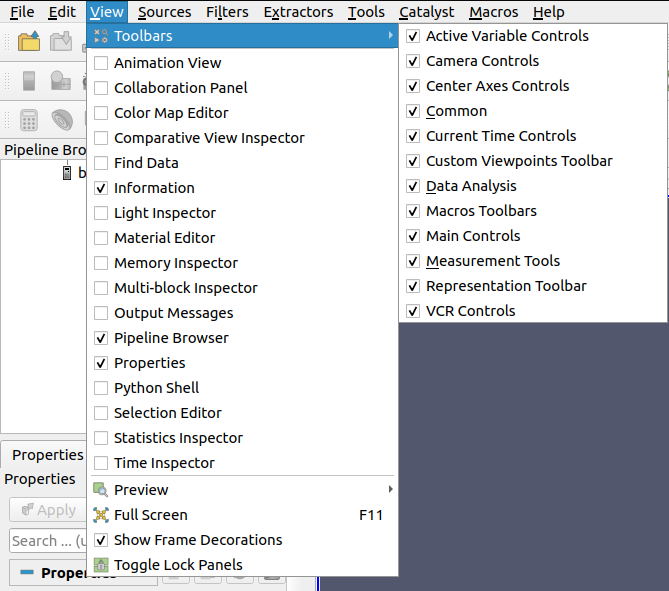
1.2.6. Getting back GUI components
If you accidentally close the Properties tab, the Information tab or the Pipeline Browser tab, open them again from the View menu.
If you accidentally undock one of the tabs, just drag it back into place, wait for a gray shadow to appear, and drop it into place.