7. Selecting Data
A typical visualization process has two components: setting up the visualization scene and performing the analysis of the results to gain insight. It is not uncommon for this process to be iterative. Often, what you are looking for drives from what filters you should use to extract the relevant information from the input datasets and what views will best represent that data. One of the ways of evaluating the results is inspecting the data or probing into it by identifying elements of interest. ParaView data selection mechanisms are designed specifically for such use-cases. In this chapter, we take a closer look at various ways of selecting data in ParaView and making use of these selections for data analysis.
7.1. Understanding selection
Broadly speaking, selection refers to selecting elements (either cells, points, table rows, etc.) from datasets. Since data is ingested into ParaView using readers or sources and transformed using filters, when you create a selection, you are selecting elements from the dataset produced as the output of source, filter, or any such pipeline module.
There are many ways to create selections. Several views provide means to
create specific selections. For example, in the SpreadSheet View , which
shows the data attributes as a spreadsheet, you can simply click on any row to
select that row. You can, of course, use the ⇧ and CTRL (or
⌘) keys to select multiple rows, as in typical spreadsheet-based
applications.
While this seems like an exercise in futility, you are hardly achieving anything by highlighting rows in a spreadsheet. What transforms this into a key tool is the fact that selections are linked among views (whenever possible). Linked selection means that you select an element from a dataset in a specific view. All other views that are showing the same dataset will also highlight the selected elements.
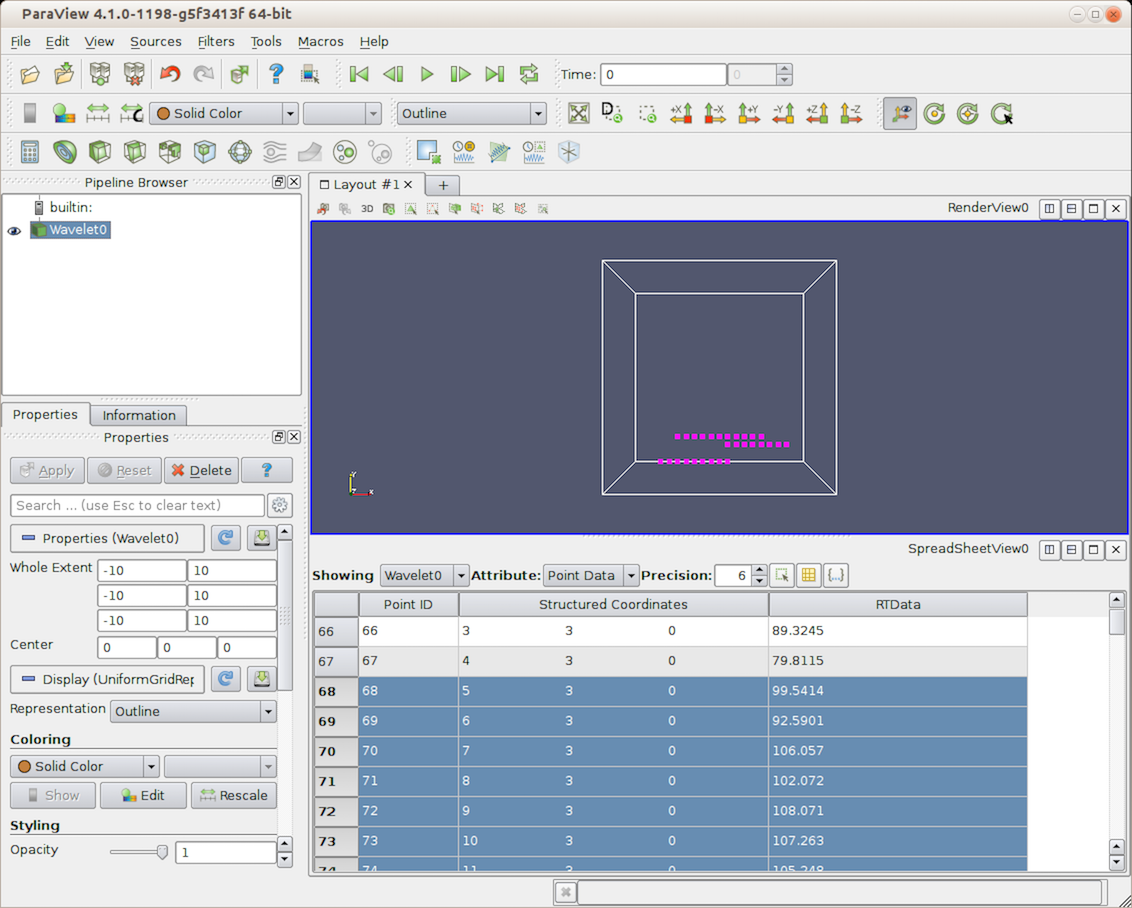
Fig. 7.1 Linked selection between views allows you to select elements in a view
and view them in all other views showing the selected data. In this demo, as we
select rows in the SpreadSheet View ,
the corresponding points in the 3D View get highlighted.
To make this easier, let’s try a quick demo:
Starting with a fresh paraview session, create a sample dataset
using the Sources > Alphabetical > Wavelet menu, and then click the Apply button. If you
are using paraview with a default setup, that should result in a
dataset outline being shown in the default Render View . Next, let’s split
the view and create SpreadSheet View . The SpreadSheet View will
automatically show the data produced by the Wavelet source. Upon closer
inspection of the header in the SpreadSheet View , we see that the view
is showing the Point Data or point attributes associated with the dataset.
Now we have the same dataset, the data produced by the Wavelet source,
shown in two views. Now, highlight a few rows in the SpreadSheet View
by clicking on them. As soon as you start selecting rows, the Render View
will start highlighting some points in space as tiny magenta specks
( Fig. 7.1). That’s linked selection in
action! What is happening is that, as you highlight rows in the SpreadSheet View ,
you are creating a selection for selecting points (since the view is
showing Point Data ) corresponding to the rows. Due to the linking of
selections between views, any other view that is showing the dataset (in this
case, the Render View ) will also highlight the selected points.
Of course, if you want to select cells instead of points, switch the
SpreadSheet View to show cells by flipping the Attribute combo-box to
Cell Data and then highlight rows. The Render View will show the
selected cells as a wireframe, rather than points.
Conversely, you could have created the selection in the Render View , and the
SpreadSheet View will also highlight the selected elements. We will see how
to create such selection later in this chapter.
The first thing to note is that, when you create a new selection, the existing selection is cleared. Thus, there is at most one active selection in the application at any given time. As we shall see, certain views provide ways of expanding on the existing selection.
The second thing to note is that selections are transient, i.e., they cannot
be undone/redone or saved in state files and loaded back. Nor can you apply
filters or other transformation to the selections themselves. There are cases,
however, where you may want to subset your dataset using the selection defined
interactively and then apply filters and other analysis to that extracted
subset. For that, there are filters available, namely Extract Selection
and Plot Selection Over Time , that can capture the active selection as
filter parameters and then produce a new dataset that consists of the
selected elements.
The third thing to note is that there are different types of selections, e.g., id-based selections, where the selected elements are identified by their indices; frustum-based selections, where the selected elements are those that intersect a frustum defined in 3D space; query-based selections, where the selected elements are those that match the specified query string; and so on.
7.2. Creating selections using views
Views provide a convenient mechanism for creating selections interactively.
Views like Render View can create multiple types of selection (id- or
frustum-based selections for selecting points and cells), while others like the
SpreadSheet View and Line Chart View only support one type (id-based
selections for points or cells).
7.2.1. Selecting in Render View
To create a selection in the Render View , you use the toolbar at
the top of the view frame. There are two ways of selecting cells,
points or blocks in ParaView: interactive and non-interactive.
ParaView enters a non-interactive selection mode when you
click one of the non-interactive selection buttons:


 The type of selection you are
creating will depend on the button you clicked. Once in
non-interactive selection mode, the cursor will switch to cross-hair
and you can click and drag to create a selection region. Once you
release the mouse,
ParaView will attempt to create a selection for any elements in the selection
region and will go back to default interaction mode.
The type of selection you are
creating will depend on the button you clicked. Once in
non-interactive selection mode, the cursor will switch to cross-hair
and you can click and drag to create a selection region. Once you
release the mouse,
ParaView will attempt to create a selection for any elements in the selection
region and will go back to default interaction mode.
To create a selection for cells visible in the view, use the
button. For selecting
visible points, use the
button instead. Visible cells (and points) are only those cells (or
points) that are currently rendered on the screen. Thus, elements that
are occluded or are too small to be rendered on the screen will not be
selected. If you want to select all data elements that intersect the
view frustum formed by the selection rectangle you drew on the screen,
use the button for cells, the
button for points, and the button for blocks.
In this case, all elements, visible or otherwise, that are within the 3D space
defined by the selection frustum are selected.
To create a selection for blocks visible in the view use the
button. Note that there is no frustum
selection for blocks.
While most selection modes allow you to define the selection region as a rectangle,
(and for points) enables you to
define the selection region as a closed polygon. However, this is limited to
surface elements (i.e., no frustum-based selection).
ParaView enters an interactive selection mode when you
click on one of the interactive selection buttons:


 . In interactive
selection mode, you act on visible elements (cells or
points). ParaView highlights elements of the dataset as you move
the cursor over them. An element can be selected by clicking on
it. Clicking repeatedly on different elements adds them to the
selection. End the interactive selection mode by clicking on
the interactive selection button pushed in or by pressing the
Esc key. This mode is also ended when you enter a
non-interactive selection mode. Use
to select all cells with the same value in the current color array as the
cell underneath the cursor (only available for
. In interactive
selection mode, you act on visible elements (cells or
points). ParaView highlights elements of the dataset as you move
the cursor over them. An element can be selected by clicking on
it. Clicking repeatedly on different elements adds them to the
selection. End the interactive selection mode by clicking on
the interactive selection button pushed in or by pressing the
Esc key. This mode is also ended when you enter a
non-interactive selection mode. Use
to select all cells with the same value in the current color array as the
cell underneath the cursor (only available for idtype arrays). Use
to do the same as the previous
icon for point data arrays. You can use the
button to
interactively select cells of the dataset and use the
button to
interactively select points.
When there are selected elements, the  button can be used to clear the selection.
Several of these buttons have hotkeys too, such as S for visible cell selection, D for visible points selection, F for frustum-based cell selection, and G for frustum-based point selection. If you notice, these are keys are right next to each other on the keyboard, starting with S, and are in the same order as the toolbar buttons themselves.
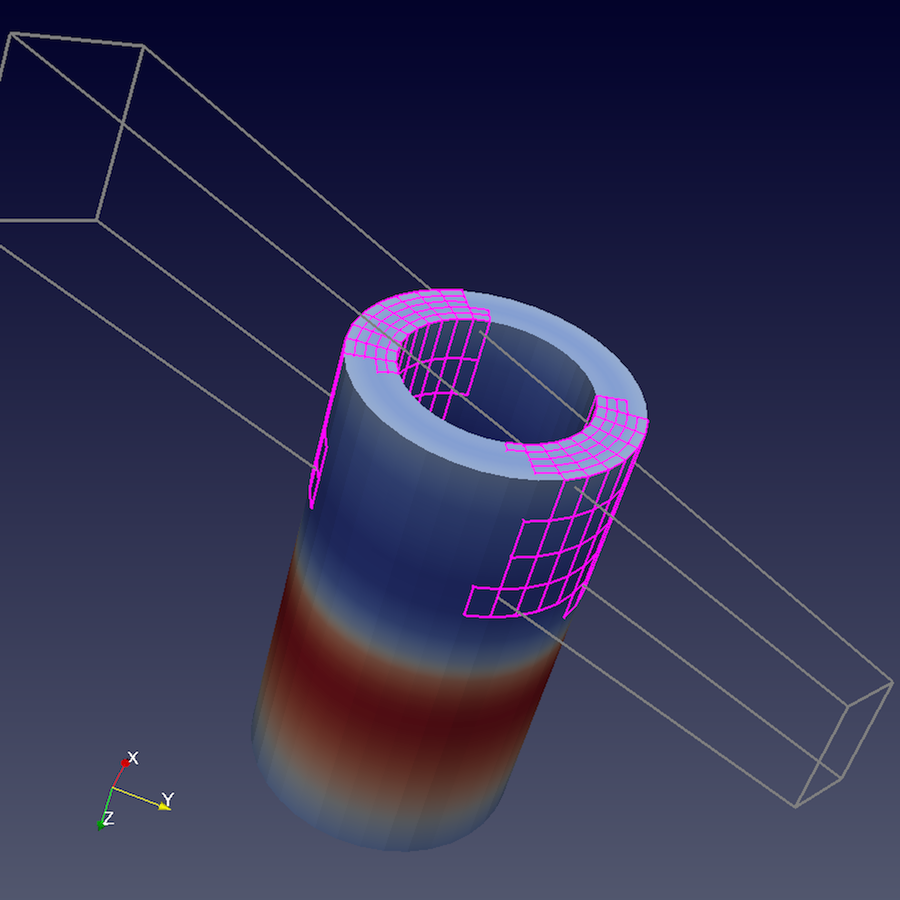
Fig. 7.2 Result of a frustum cell selection on disk_out_ref.ex2 dataset showing the frustum used to identify selected cells. All cells that fall in that frustum or that intersect it are selected, irrespective of whether they were visible from the view angle when the selection was made.
Did you know?
You can expand the current selection by keeping the CTRL (or ⌘) key pressed
when clicking and dragging in selection mode. paraview will then add the current
selection. You can also subtract from the current selection using the ⇧, or
even toggle using CTRL (or ⌘) + ⇧. Selection modifier buttons, in the
toolbar, can be used for the same effect. Add :  , remove :
 , toggle :
  . These modifiers do not work,
however, if the selected data is different from the current selection. If so, the
current selection will be cleared (as is the norm) and then the new selection will be created.
. These modifiers do not work,
however, if the selected data is different from the current selection. If so, the
current selection will be cleared (as is the norm) and then the new selection will be created.
7.2.2. Selecting in SpreadSheet View
To create a selection in the SpreadSheet View , you simply click on the
corresponding rows in the spreadsheet. You can use the CTRL (or
⌘) and ⇧ keys to add to the selection.
Based on which data attribute the view is currently showing, i.e., Point
Data , Cell Data , or Row Data , the selection will select points,
cells, or rows, respectively.
7.2.3. Selecting in Line Chart View
Line Chart View enables you to select the elements corresponding to the
plotted data values. The selection interaction is similar to Render View .
By default, you are in the interaction mode. You enter selection mode to create a
selection by using the buttons in the view toolbar for creating a rectangular
selection  or a polygonal selection
 . Once in selection mode, you
can click and drag to define the selection region. The selection is created once
you release the mouse press.
. Once in selection mode, you
can click and drag to define the selection region. The selection is created once
you release the mouse press.
When a new selection is created, by default, it
will clear any existing selection in the view.
The selection modifier buttons in the view toolbar
can be used to control whether a new selection adds to selected elements
, removes
points from the selected elements , or
toggles it . These modifier
buttons are mutually exclusive and modal, i.e., they remain pressed until you
click to unpress them or until you press another modifier button.
CTRL (or ⌘) and ⇧ can also be used to
add to/subtract from the selection.
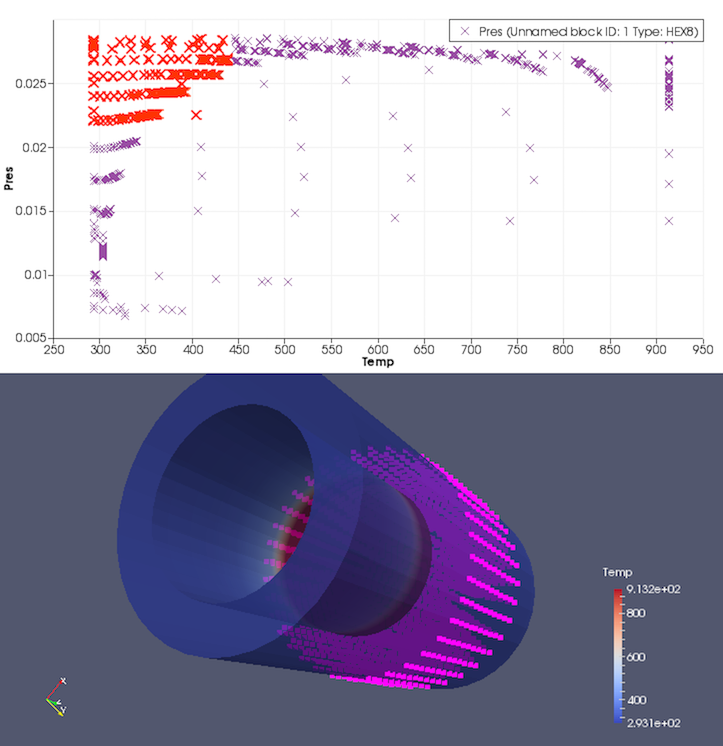
Fig. 7.3 Selection in Line Chart View can be used to locate elements
matching attribute criteria. In this visualization, by generating a scatter
plot plotting Pres against Temp in the disk_out_ref.ex2 dataset by
selecting the top-left corner of the Line Chart View , we can easily locate
elements in the high Pres, low Temp regions in the dataset.
7.3. Creating selections using the Find Data panel
Views provide mechanisms to create selections interactively. Selections in chart
views and SpreadSheet View can be used to select elements with certain data
properties, rather than spatial locations
( Fig. 7.3). For a richer data-based selection
for selecting elements matching certain criteria, you can use the Find Data
mechanism in paraview.
The Find Data panel can be accessed from the Edit menu, View menu,
or by using the keyboard shortcut V or the  button on the
 Main Controls toolbar.
The Find Data panel can be split into three sections,
reflecting how you would use this dialog. The Create Selection section
helps you define the selection criteria. This identifies which elements, cells or
points, are to be selected. The Selected Data section shows the
results from the most recent selection. They are shown in a tabular view similar
to the Spreadsheet view. Finally, the Selection Display section
lets you change how the selected elements are displayed in the active view.
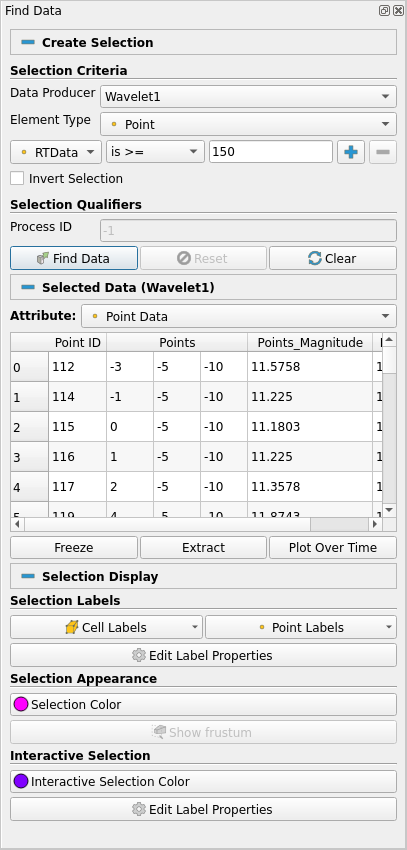
Fig. 7.4 The Find Data panel can be used to find
data elements matching specific conditions. In this example, we are selecting
all Points in Wavelet1 dataset where RTData is \(>= 150\).
You can create selections in the Find Data panel using
the widgets under the Create Selection section. First, choose the data
producer. This is the source or filter from which you want to select
elements from. Next choose the element type. If you want to select cells,
choose Cell, for points choose Point and so on. The next step is to
define the selection criteria. The left-most combo-box is used to
select the array of interest. The available options reflect the data array
currently available on the dataset. The next combo-box is used to select the
operator. Options include the following:
ismatches a single valueis in rangematches a range of values specified by min and maxis one ofmatches a list of comma-separated valuesis >=matches all values greater than or equal to the specified valueis <=matches all values lesser than or equal to the specified valueis minmatches the minimum value for the array for the current time stepis maxmatches the maximum value for the array for the current time stepis <= meanmatches values lesser than or equal to the meanis >= meanmatches values greater than or equal to the meanis meanmatches values equal to the mean within the specified tolerance
Based on your selection of the operator, input widgets will be shown next to
this combo-box, where you enter the corresponding values. For example, for is
between, you enter the min and max values for defining the range in the two
text entry widgets.
Multiple selection criteria can be combined together. For example, you want to
select all points with Temp >= 100 and Pres <= mean, simply setup two
expressions using the  button.
Once you are satisfied with the selection criteria, hit the Find Data
button. On success, the Current Selection
spreadsheet will update to show the selected elements. Use the Attribute
combo-box to change which element types are shows in the spreadsheet.
Similar to selecting in views, once you create a selection, any view showing the
selected data will also highlight the selected elements, if possible. For example, the
Render View will show a colored wireframe marking the selected elements,
SpreadSheet View will highlight the rows, and so on. The Selection Display
section lets you change how the selection is displayed in the active view.
Currently, it is primarily designed for Render View. In the
future, however, it could support changing selection attributes for other views as well.
The available options allow you select the color to use to show the selected
elements, as well as the data attributes to use to label the cells/points. For finer
control on the label formatting, color, font, etc., toggle the
 button on. That will pop up the
 Edit Label Properties dialog
( Fig. 7.5).
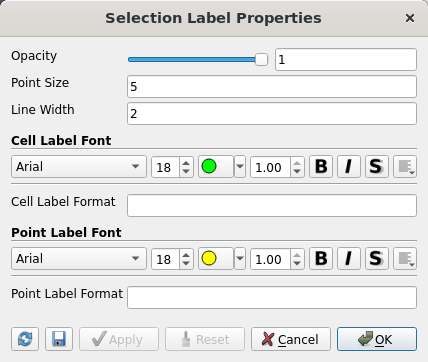
Fig. 7.5 Selection Label Properties dialog for controlling
selection labeling parameters.
Did you know?
Besides creating new selections, the Find Data dialog can also be used
to inspect the current selection made from outside the dialog. For
example, if you select elements in the Render View using the options
described in Section Section 7.2.1, the Current
Selection component in the Find Data dialog will indeed update to
reflect the newly selected elements. Furthermore, you can change its display
properties and extract this selection using the extraction buttons
(which we will cover in Section Section 7.6).
7.4. Creating selections in Python
Another way to create selections is through ParaView’s Python scripting interface.
Python functions exist that are analogous to the selection operations available in the ParaView
Render View and Find Data dialog. Let’s take a look at an example.
# import the selection module
from paraview.selection import *

renderView1 = GetActiveView()

# Create an initial rectangular selection in the render view
SelectSurfacePoints(Rectangle=[200, 321, 600, 744], View=renderView1)

# Add points within a polygon in the active view
SelectSurfacePoints(Polygon=[180, 200, 190, 400, 322, 300], Modifier='ADD')

# Subtract points with another rectangle
SelectSurfacePoints(Rectangle=[300, 400, 500, 700], Modifier='SUBTRACT')

# Now extract and show the selected points into another dataset
ExtractSelection()
Show()

# Clear the selection
ClearSelection()
The script starts out by importing functions from the paraview.selection
module. Next, it creates a reference to the active render view and
passes it into the selection functions. The first selection function selects points
visible in the render view within a rectangular region. The rectangle is defined
by bottom left and upper right points, (200, 321) and (600, 744), given in pixel coordinates.
The second selection is of visible points within a polygon defined by the points
(180, 200), (190, 400), and (322, 300). In this call, the selection function
modifies the existing selection so that newly selected points are added to the selection.
This is controlled with the Modifier named function parameter.
Other options for the Modifier parameter are 'SUBTRACT' , 'TOGGLE' ,
and None . When the Modifier is set to None , the previous selection
gets replaced with the new selection. The last call to SelectSurfacePoints
subtracts points from the current selection, which is the combination of the first
two selections.
The last lines in this example script extract the currently selected points from
the currently active source and shows them on the screen. Lastly, the selection
is cleared with the ClearSelection function.
Selections by point or cell ID numbers are also possible, as shown in this example:
from paraview.selection import *

# Select cell 1 from all blocks in a multiblock dataset on process 0
SelectIDs(IDs=[0, 1], FieldType='CELL')

# Add cell 3 from block 4 on process 0 and cell 5 from block 6 on process 1
# to the selection
SelectCompositeDataIDs(IDs=[4, 0, 3, 6, 1, 5], Modifier='ADD')
When updating a selection that is part of a pipeline (i.e. via the
ExtractSelection filter) one needs to perform a new selection and update the
Selection property of the ExtractSelection filter. For example:
from paraview import simple

wavelet = simple.Wavelet()
simple.Show()
simple.Render()
SELECTION_SUITE = [
    [-1, 0],         # select cell 0 from the unique block of the dataset
    [-1, 0, -1, 1],  # select cells 0 and 1 from the unique block of the dataset
    [-1, 0, -1, 1, -1, 2],
]

simple.SelectIDs(IDs=SELECTION_SUITE[0], Source=wavelet)
extract = simple.ExtractSelection(Input=wavelet)

for ids in SELECTION_SUITE[1:]:
    # clear previous selection
    simple.ClearSelection()
    # perform a new selection.
    simple.SelectIDs(IDs=ids, Source=wavelet)
    # get the selection object accosiated with the current selection on output port 0
    selection = wavelet.GetSelectionInput(0)
    # update Selection property of extract filter
    extract.Selection = selection
    # run the extraction filter using the latest property values
    extract.UpdatePipeline()
The selection line width as follows:
disp = GetDisplayProperties()
disp.SelectionLineWidth = 5
Finally, selections by query expressions are also possible via the Python selection API.
As an example, the following selects cells that have the maximum value for
a cell variable named EQPS in the currently active source:
from paraview.selection import *

QuerySelect(QueryString='EQPS == max(EQPS)', FieldType='CELL')
The complete list of selection functions are briefly
described below. For full documentation on these functions, you can invoke the
help function on any of the functions, e.g., help(SelectSurfaceCells) .
SelectSurfacePoints- Select visible points within a rectangular or polygon region.SelectSurfaceCells- Select visible cells within a rectangular or polygon region.SelectSurfaceBlocks- Select visible blocks within a rectangular region.SelectPointsThrough- Select all points within a rectangular region regardless of their visibility.SelectCellsThrough- Select all cells within a rectangular region regardless of their visibility.SelectGlobalIDs- Select attributes by global IDs.SelectPedigreeIDs- Select attributes by Pedigree IDs.SelectIDs- Select attributes by attribute IDs.SelectCompositeDataIDs- Select attributes by composite attribute IDs.SelectHierarchicalDataIDs- Select attributes by hierarchical data IDs.SelectThresholds- Select attributes in a source by thresholding on values in an associated array.SelectLocation- Select points by location.QuerySelect- Selection by query expression.ClearSelection- Clears the selection on the source passed in as a parameter.
7.5. Displaying selections
The Find Data panel provides easy access to changing the Selection
Display Properties for the selection in the active view. The Current Selection
section in the Find Data dialog shows the selected elements in a spreadsheet
view. You can also make a regular SpreadSheet View do the same by checking
the  button in the view toolbar to show only selected elements.
7.6. Extracting selections
All the types of selections created through mechanisms discussed so far are
transient and primarily used for highlighting data. If you want to do further
operations on the selected subset, such as extract the selected elements and
then save the result out as a new dataset or apply other filters only on the
selected elements, then you need to use one of the extract selection filters.
The Extract Selection and Plot Selection Over Time filters fall in
this category of filters.
7.6.1. Extract selection
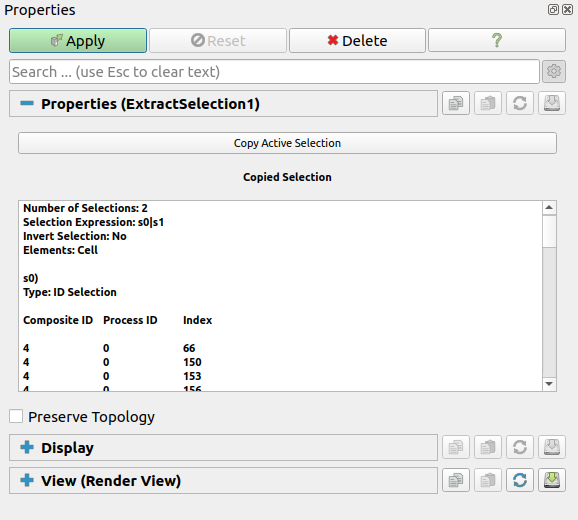
Fig. 7.6 Properties panel showing the properties for the
Extract Selection filter.}
The Extract Selection filter is used to extract the selected elements as a
new dataset for further filtering. There are multiple ways of creating this
filter. You can use the conventional method for creating filters, i.e., using the
Filters menu. When the filter is created, if there is any active
selection, the filter will automatically copy that selection for convenience.
Another way to extract the active selection is using the Extract button
in the Find Data panel ( Fig. 7.4).
The Properties panel shows what defines the selection. You can update the
selection by making a new active selection using any of the mechanisms described
earlier in this chapter and then clicking on the Copy Active Selection
button on the Properties panel for the Extract Selection filter.
By default, the filter is set up to extract the selected elements alone. This
filter also supports passing the entire input dataset through by simply
marking which elements are selected. For that, check the Preserve Topology
check box on the Properties panel.
7.6.2. Plot selection over time
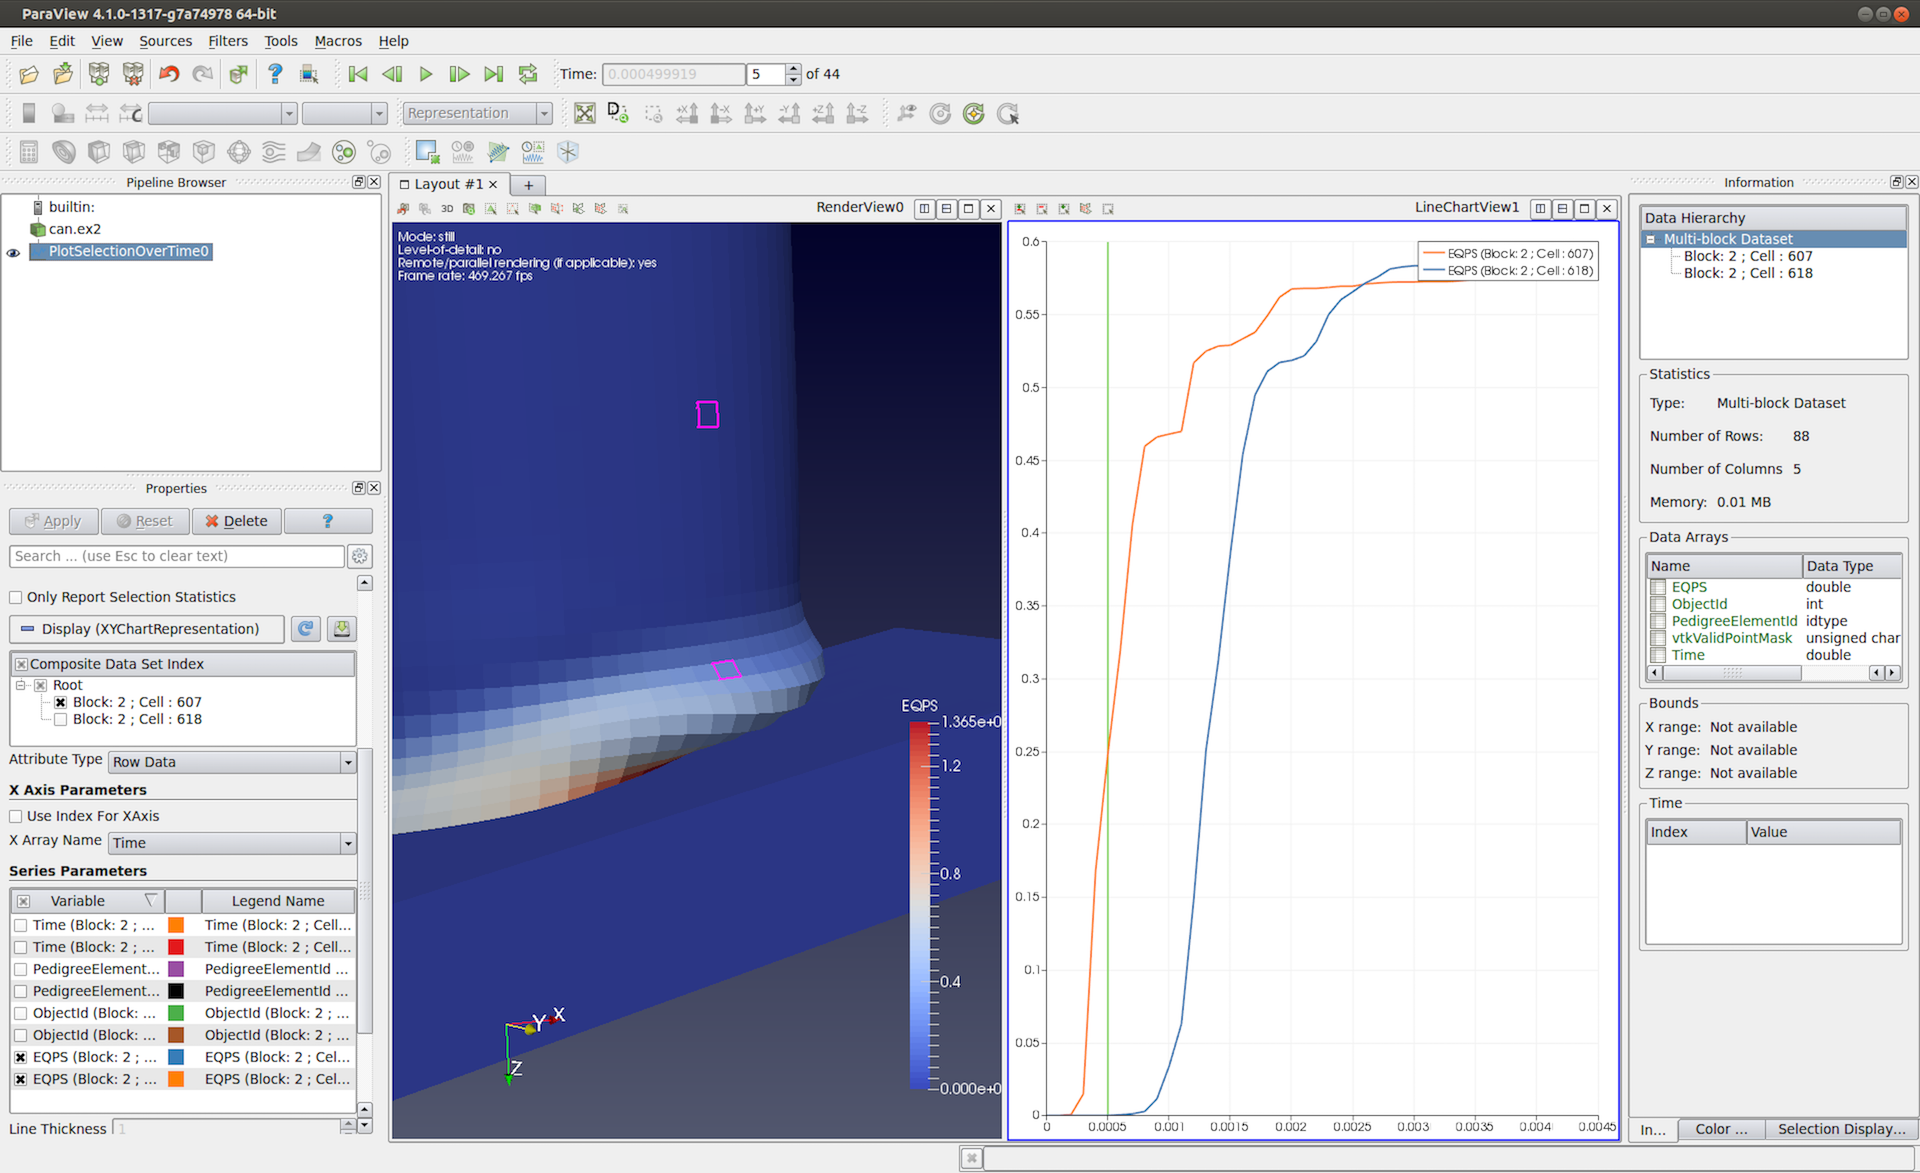
Fig. 7.7 Plot Selection Over Time in action in paraview. The
filter provides a convenient way to plot changes in attributes over time for the
selected set of cells or points in a temporal dataset.
Plot Selection Over Time is similar to Extract Selection in the sense
that it too extracts the selected elements from the input dataset. However,
instead of simply extracting the result, the goal here is to plot attributes at the
selected elements over time.
Fig. 7.7 shows an example use of this filter. In
this case, we wanted to see how the strain (or EQPS) cell attribute
changes over time for two specific cells that we selected in the Render
View using the view-based selection mechanism. The selected cells are the
highlighted elements in the left view. After having selected the cells, we
create the Plot Selection Over Time filter using the Filters > Data Analysis
menu. (You could also use the  from the
 Data Analysis toolbar.) Similar to the Extract Selection
filter, when this filter is created, it copies the active selection. You can
change it afterwards using the Copy Active Selection button on the filter’s
Properties panel. On hitting Apply , paraview will show a
visualization similar to the one shown here.
Instead of using the view for defining the selection, you could have used the
Find Data panel. In that case, instead of being able to plot each element
over time, you will be plotting summaries for the selected subset over time.
This is essential since the selected subset can have a varying number of
elements over time. The summaries include quantities like minimum, maximum, and
median of available variables. You can make the filter always produce these
statistics alone (even when the selection is created by selecting specific elements
in a view) by checking the Only Report Selection Statistics property on the
Properties panel for the Plot Selection Over Time filter.
7.7. Freezing selections
When extracting selections, you can use views or the Find Data panel to
define the selection. Since the extraction filters are indeed like any other
filters in ParaView, they are re-executed any time the input dataset changes,
properties on the filter change, or the current time changes. Every time the
filter re-executes, it performs the selection and extraction
operations. Thus, if you created the selection using Render View to create
an id-based selection, the filter will identify which of the elements are of the
requested ids and then pass those. For frustum-based selection, it will
determine what elements fall within the frustum and extract those. Similarly,
with query-based selections created using the Find Data panel, the query
is re-evaluated. This can result in the selection of different elements with changes
in timestep. For example, if you are selecting the cells where the strain is
maximum, the selected cell(s) will potentially be different for each time step. Suppose
you want to plot the changes in a cell that has maximum strain at the last
time step – how can we do that? The answer is using the Freeze
Selection button on the Find Data panel. What that does is convert any
type of selection (frustum, query-based) to an id-based selection matching the
currently selected element ids. Now you can use this frozen, id-based selection
for Extract Selection or Plot Selection Over Time.
7.8. Saving and combining selections using the Selection Editor panel
Views and Find Data panel can be used to create different types of selections.
To save and combine the created selections, you can use the Selection Editor panel.
This panel can be accessed from the View → Selection Editor.
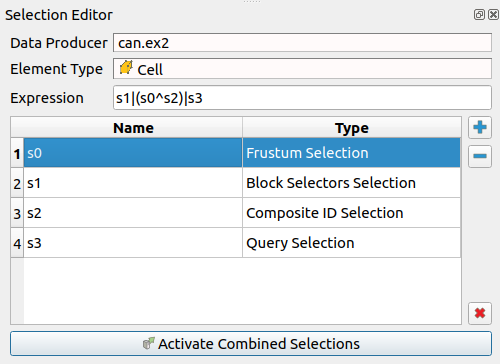
Fig. 7.8 The Selection Editor panel can be used to combine selections.
In this example, we are combining frustum, block selector, composite ID and query selections.
The Selection Editor panel allows you to save selections and combine them using
a boolean expression. This panel shows several pieces of static and editable information:
An information-only
Data Producerfield is set based on the source of the active selection. If the selected object changes, the data producer will change as well, and any saved selections from the previous data producer will be deleted.An information-only
Element Typefield (cell or point) that is set based on the element type of the active selection. If a selection is saved and a new active selection is made that has a different element type, ParaView prompts for confirmation to delete all existing saved selections and changes the element type to that of the new active selection.An editable
Expressionstring that defines how to combine the saved selections into a single active selection. This string is automatically filled while adding new selections to the saved selections, meaning that the combined selection will be the union of all saved selections. Selections can be combined using the not (!) operator, or (|) operator, and (&) operator, and xor (^) operator. Parentheses are available to define precedence as well.An editable table lists an automatically assigned name for the selection (s0, s1, s2, etc.), which is used in the
Expressionproperty, and the type of the selection. When a selection is highlighted in the saved selections table and ParaView’s active view is aRender View, the highlighted selection will be shown in thatRender View. When a selection is unhighlighted, it is no longer shown in theRender View.
Several buttons next to the saved selection table control the addition and removal of selections in the saved list:
+(Add Active Selection) button that adds the active selection to the list of saved selections.-(Remove Selected Selection) button that removes the selected saved selection from the list of saved selections.X(Remove All Selections) button that removes all saved selections from the list of saved selections.Activate Combined Selectionsbutton that sets the combined saved selections as the active selection.
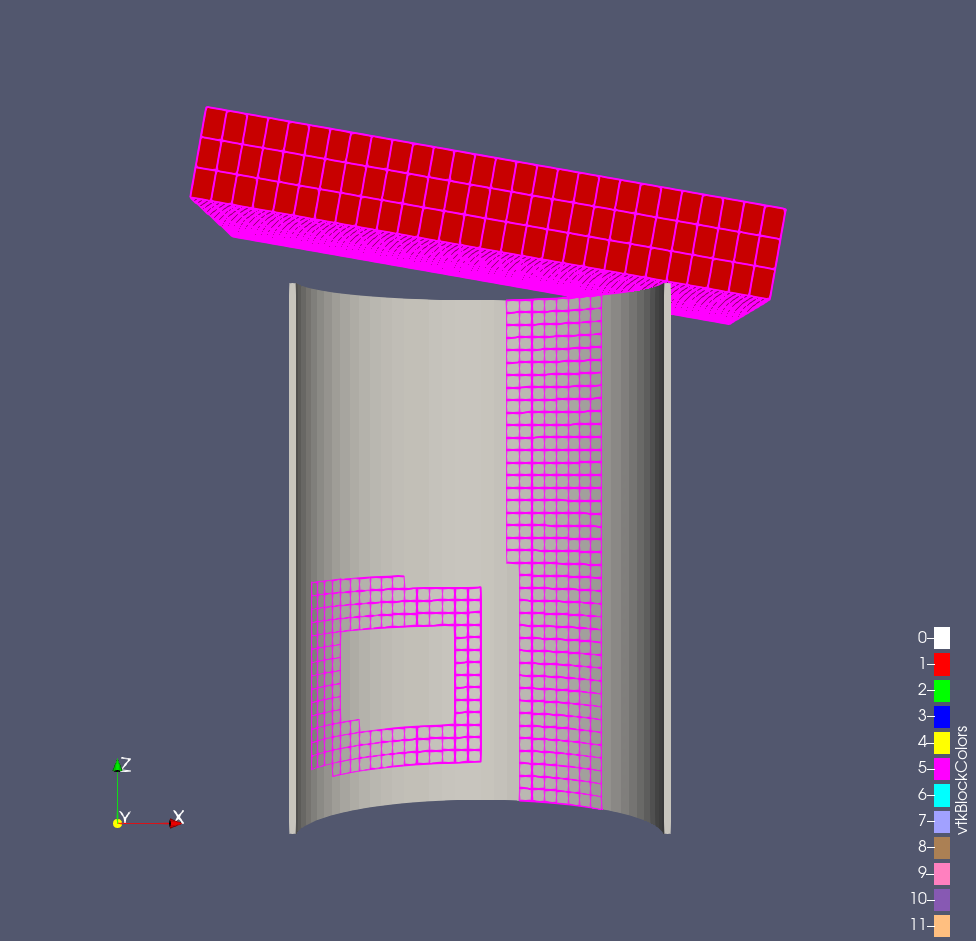
Fig. 7.9 The result of combining the selections as shown in Fig. 7.8.